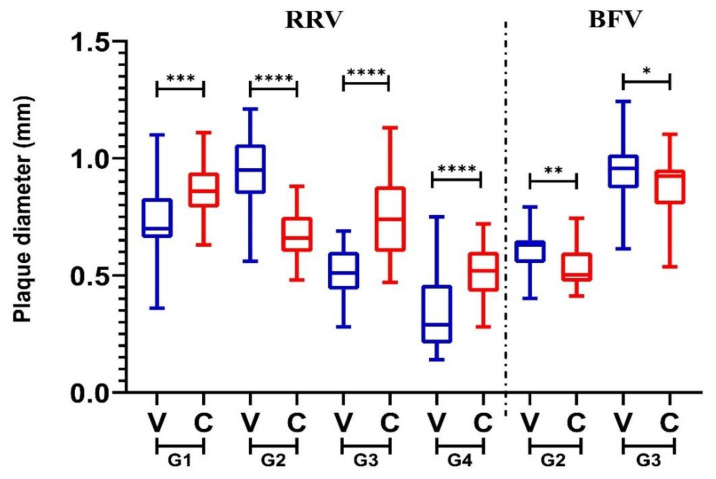
Figure 6.
Size (diameter, mm) comparisons of plaques produced following inoculation of Vero cells with C6/36 (C, red) or Vero (V, blue) supernatant following infection with genotypes 1–4 (G1–4) of Ross River virus (left of the line) or G2–3 of Barmah Forest virus (right of the line). Plaque sizes produced in C or V cells were compared for each virus, significance values are shown above these datasets (**** p ≤ 0.0001,*** p ≤ 0.001 ** p ≤ 0.01, * p ≤ 0.05) as determined by the student t-test.

