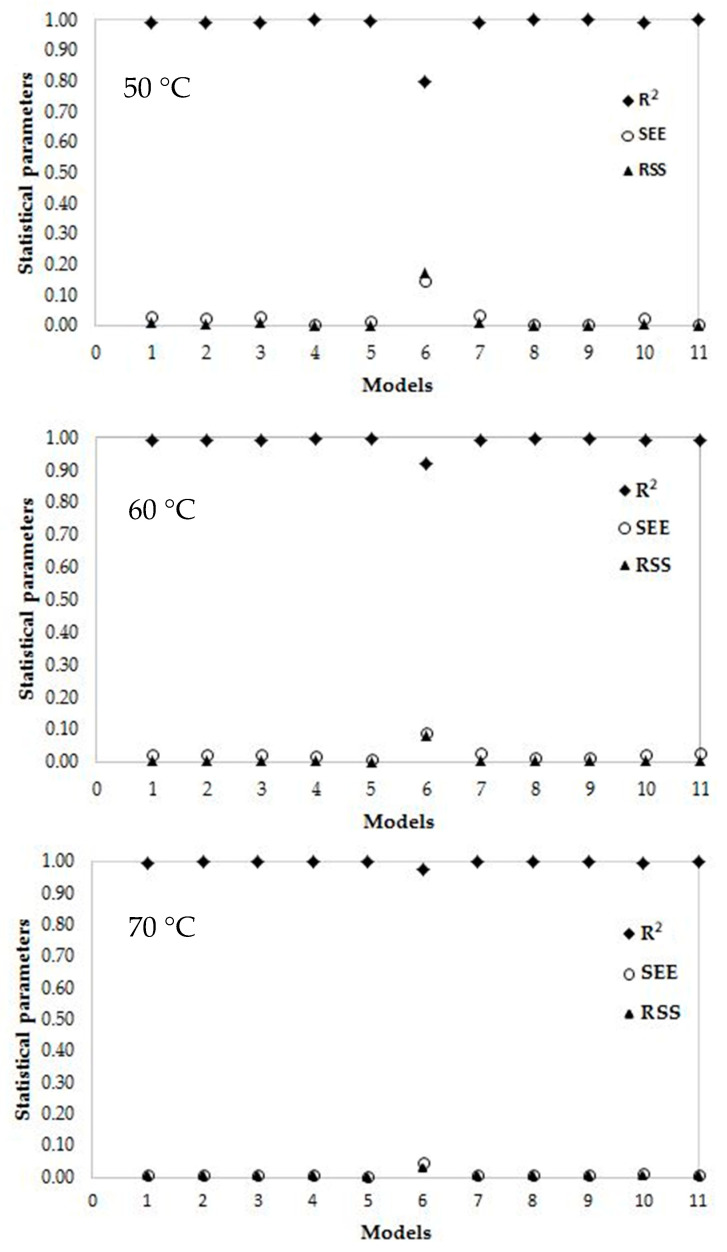
Figure 6.
Statistical parameters of each model for different infrared (IR) drying temperatures. Where MR is the moisture ratio (dimensionless); k, the drying rate constant (h−1); t, the time (h) and a, n and b are experimental constants. The determination coefficient (R2), residual sum of squares (RSS) and standard error of estimate (SEE). Thus, the Midilli et al. [34] model may be assumed to represent the drying behavior of Linden leaves for 50 °C and 60 °C temperatures. It was emphasized that the Midilli et al. model [34] exhibited similar results in many other studies such as eggplant [31], kaffir lime leaves [51], carrot slices [56], Moroccan rosemary leaves [40], and pepper [20]. In addition, two- term and Logarithmic models gave relatively good results (Table 2 and Figure 6). Doymaz, I [57] surveyed four different thin-layer drying models (Lewis, Henderson, and Pabis, Modified Page, and logarithmic) and used determination coefficient, reduced R2, and RMSE for comparing. According to the results, logarithmic model showed a good fit than the other models.

