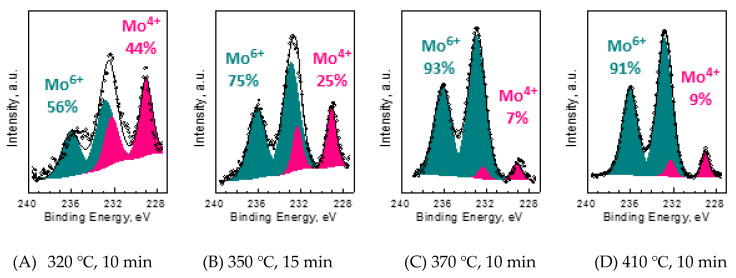
Figure 2.
Our XPS results. (A–D) The XPS Mo 3d core line spectra of MoS2 flakes heated in different temperatures presented together with the charts showing the concentrations of Mo4+ and Mo6+ ions within the surface layer of the flakes. The contributions coming from different oxidation states were fitted to the spectra and are presented in the charts below.

