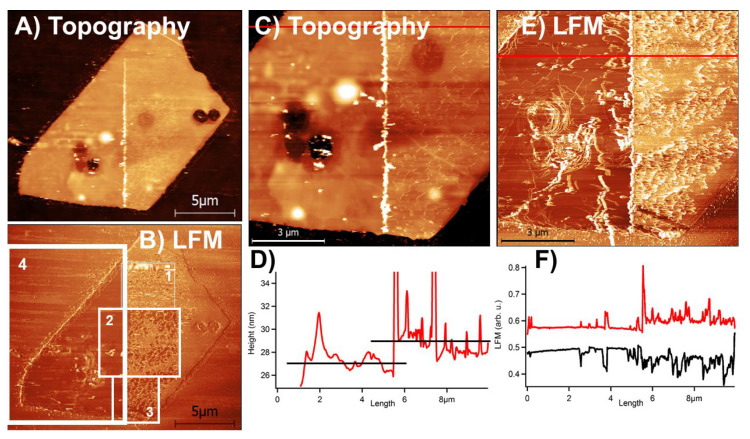
Figure 3.
Removing the surface-bound MoO3 oxide layer on a single MoS2 flake with an AFM tip. The images show AFM recorded topography for (A,C) and uncalibrated friction (LFM signal) for (B,E). (B) shows that the flake was continuously scratched in zones 1, 2, 3 and 4 with a progressively increasing number of rescans between the zones. In the zone “4” the flake was rescanned more than 10 times, which produced complete removal of the oxide layer. (C) shows a close-up on the topography data from (A). (D) presents a topography cross-section line, marked in red in (C), to show that a removed oxide layer was 2 ± 1 nm thick. (E) shows an LFM signal corresponding to (C). (F) shows a friction loop along a cross-sectional line presented in red in (E). A friction loop is an LFM signal recorded in trace (R− > L) and retrace (L− > R) scanning. It corresponds to twice of the uncalibrated friction. For (A,C) brighter colors represent higher portions of the image (Z-scale), while for (B,E) brighter colors represent higher values of the lateral force microscopy (LFM) signal. Z-scale in (A) was 60 nm or (C) 43 nm.

