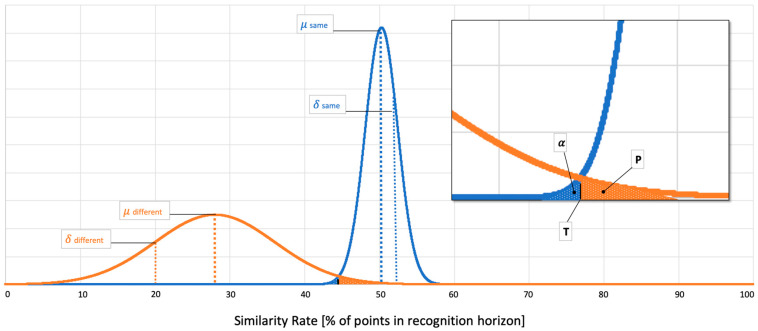
Figure 2.
Example for two normally distributed probability curves (orange = between subject comparison; blue = within subject comparison; thin and thick dashed lines in orange and blue symbolize mean and standard deviation (δ); T is the border for rating different (left of T) and same (right of T); α-area = probability of not identifying a subject; P-area = probability of a false positive identification).

