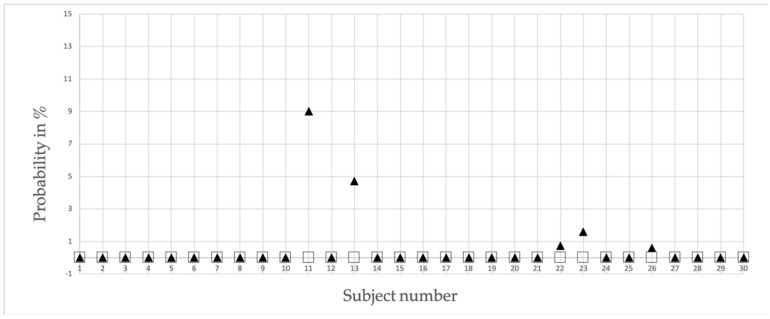
Figure 4.
False positive detection probability chart displaying the individual percentages of all subjects. Squares = Super attractor versus the first run of the same person and filled triangles = Super attractor versus the second run of the same person. When probability is zero, squares are partly hidden by filled triangles.

