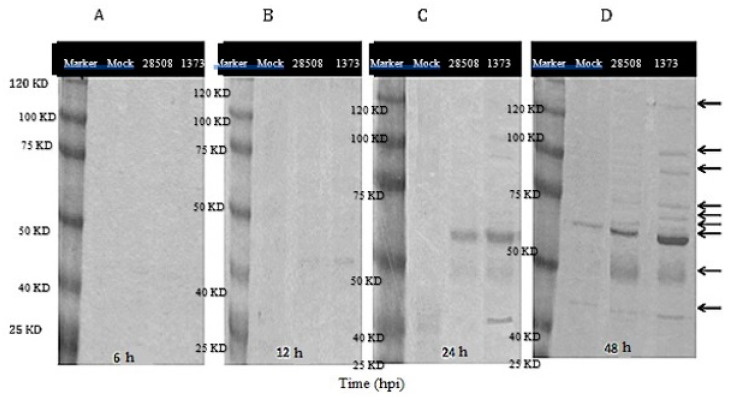
Figure 9.
Protein electrophoresis of supernatants from BVDV infected and mock-infected MDM at (A) 6 hpi, (B) 12 hpi, (C) 24 hpi and (D) 48 hpi. Marker: protein marker that range from 25 to 120 KD, Mock: non-infected macrophage control, 28508: supernatant from 28508-5-infected macrophage at different timepoints, 1373: supernatant from 1373-infected macrophage at different timepoints, 6, 12, 24, 48 hpi: the corresponding timepoints post treatment of macrophage with supernatant, arrows refer to the different band intensity between strains.

