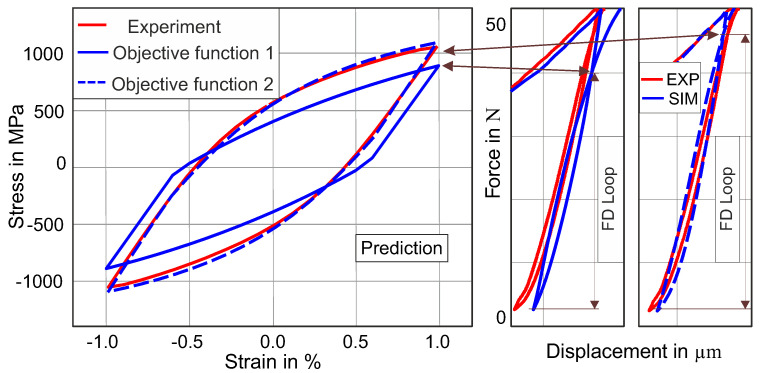
Figure 7.
Effect of ΔF on the uniaxial stress–strain hysteresis prediction. The solid blue force-displacement (FD) loop displays the fitting of the FD loop to the blue experimental FD loop by using objective function 1, while the dotted solid stress–strain hysteresis is the prediction of stress–strain hysteresis. Similarly, the dotted blue FD loop shows the fitting of the FD loop by using objective function 2, while the dotted blue stress–strain hysteresis represents the prediction of the stress–strain hysteresis.

