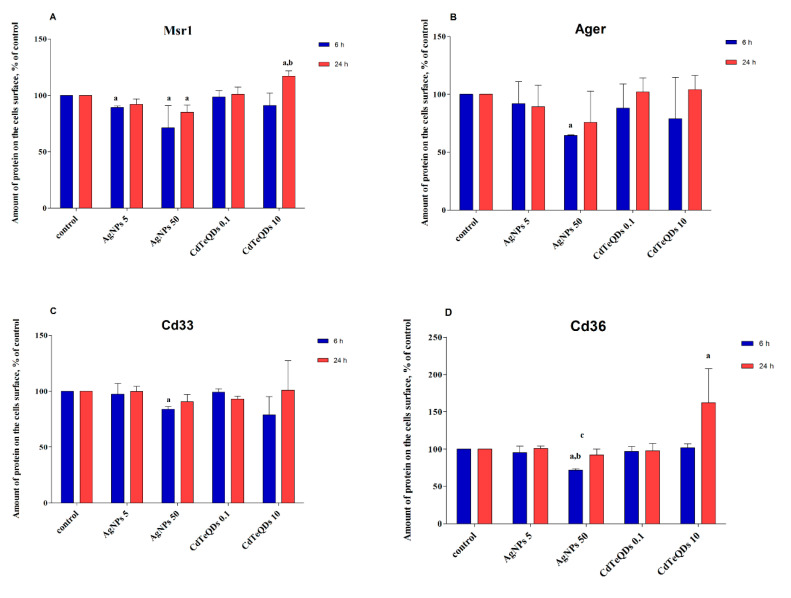
Figure 7.
The abundance of Msr1 (A), Ager (B), Cd33 (C)or Cd36 (D) receptors on the BV-2 cells surface by flow cytometry. The cells were treated with CdTeQD (0.1 or 10 µg mL−1) or AgNP (5 or 50 µg mL−1) for 6 or 24 h. Mean ± SD, n = 3. ‘a’ denotes statistically significant difference from unexposed control, ‘b’ denotes statistically significant difference between low and high concentration of NP, ‘c’ denotes statistically significant difference between 6 and 24 h treatment, two-way ANOVA, post-hoc Tukey’s test, p < 0.05.

