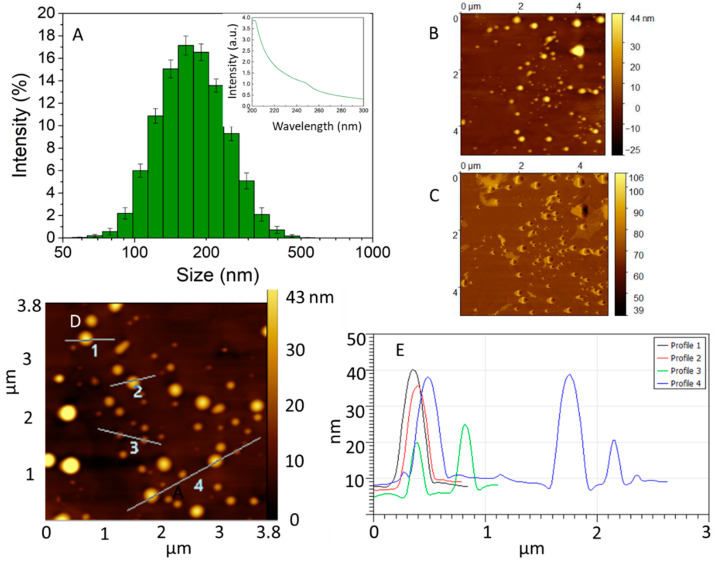
Figure 2.
(A) Dynamic light scattering (DLS) data of dispersions of 1 mg/mL propolis showing the main NP population between 70–300 nm. Inset: UV-vis spectra of the propolis ethanolic extract showing an absorption band at 250 nm. AFM image of (B) the topography and (C) the phase of NPs adsorbed on highly pyrolytic oriented graphite. (D) AFM topography image showing line profiles. (E) Cross-section height derived from the line profiles shown in (D); nanoparticles between 3 to 40 nm height were imaged.

