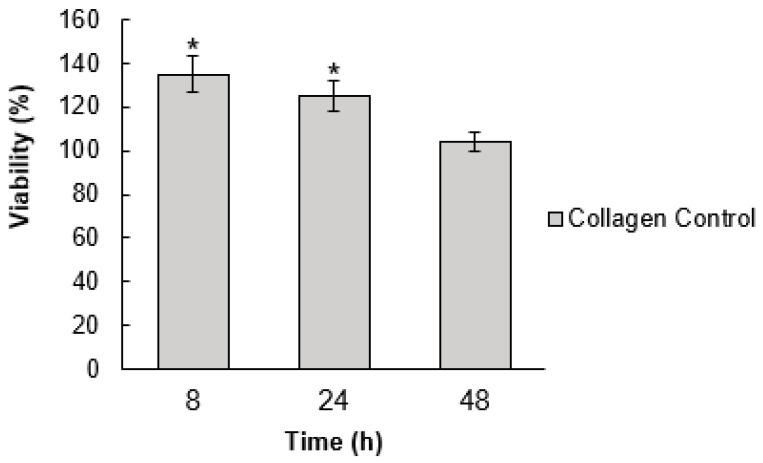
Figure 6.
Cell viability of a 3T3 cell line incubated with collagen for 8, 24, and 48 h. The values were normalized with the results obtained for cells growing in culture media (mean % ± SD). Significant differences at p ≤ 0.05 are indicated by an asterisk (*). Significance was determined using an analysis of variance (ANOVA) test.

