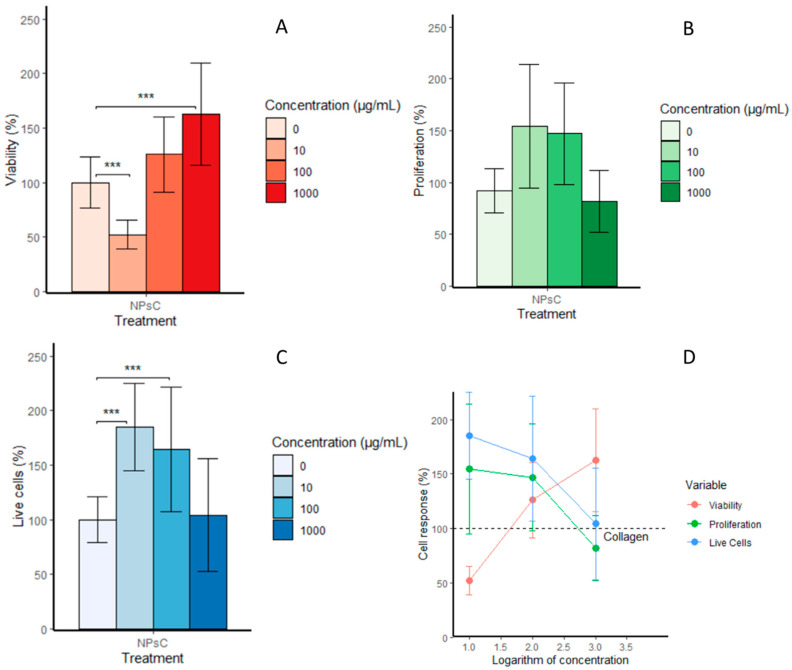
Figure 7.
(A) Cell viability of 3T3 cell line incubated with collagen and collagen impregnated with propolis NPs at concentrations of 10, 100, and 1000 μg/mL (mean % ± SD). (B) Total cell count means determined using a proliferation assay. (C) Number of living cells. (D) Correlation of cell response and propolis NP concentration. Significant differences at p ≤ 0.05 are indicated by a line and asterisks (***). Significance was determined using an analysis of variance (ANOVA) test.

