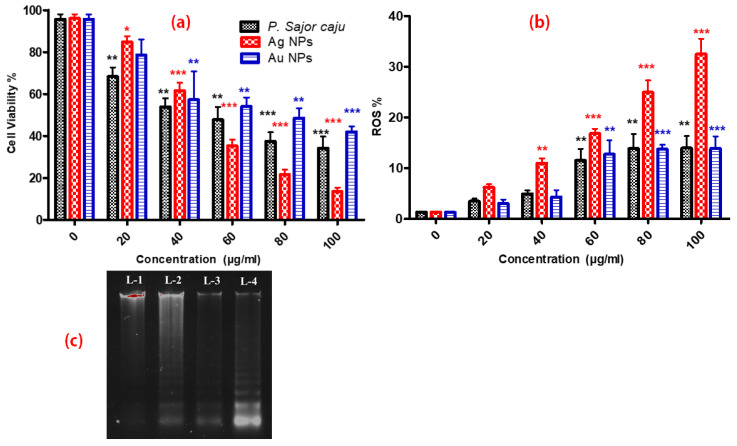
Figure 8.
(a) Cell viability of HCT-116 cell line at various concentrations (20–100 μg/mL) of PS extract, Ag NPs and Au NPs. (b) Intracellular ROS production against HCT-116 cell line at various concentrations (20–100 μg/mL) of PS extract, Ag NPs and Au NPs. (c) DNA fragmentation assay using agarose gel electrophoresis. Lane 1- Control, Lane 2- aqueous PS extract, Lane 3- Au NPs, Lane 4- Ag NPs treated HCT-116 cell line. All data were analysed by one-way ANOVA using post hoc Dunnett’s test. p < 0.05 was considered to be statistically significant between exposed and control groups. The symbols *, *, *** show statistical significance using one-way ANOVA (p < 0.05, p < 0.01, p < 0.005, respectively), compared to positive control.

