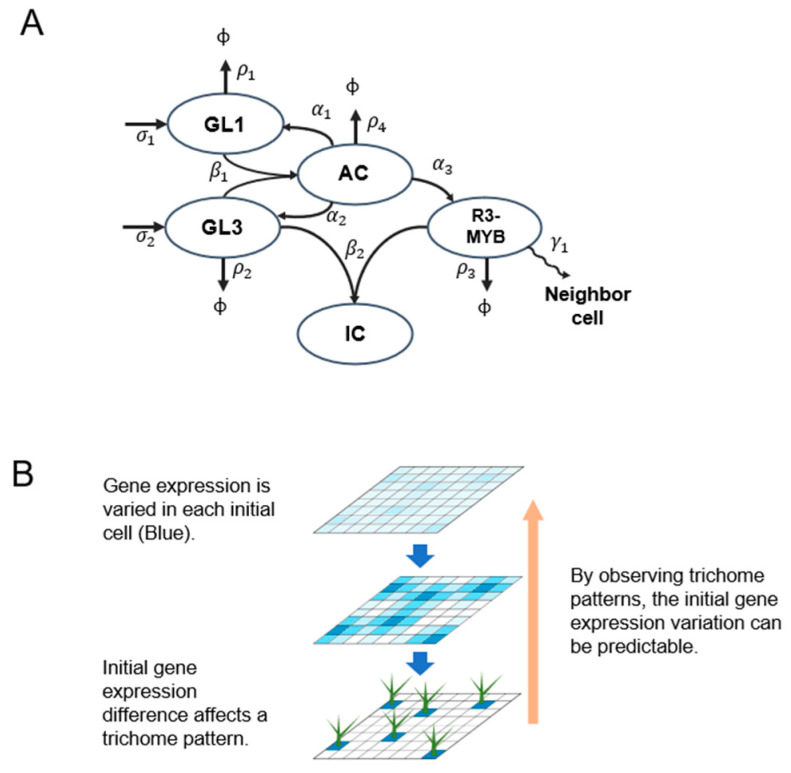
Figure 1.
Concept of the hypothesis proposed in the text. (A) Interaction scheme underlying trichome formation. GL1 and GL3 are expressed at rates of σ1 and σ2, respectively. GL1 and GL3 form an active complex (AC) at rate β1 to activate GL1, GL3, and R3-MYB at rates α1, α2, and α3, respectively. GL3 and R3-MYB interact at rate β2 to form an inactive complex (IC). GL1, GL3, AC, and R3-MYB are degraded at rates ρ1, ρ2, ρ4, and ρ3, respectively. The R3-MYB complex moves to neighboring cells at rate γ1. (B) Schematic representation of the hypothesis proposed in the text. Gene expression variation between cells is represented by the intensity of the blue color (top). Gene expression variations increased (middle), and trichomes eventually formed based on the initial gene expression variations (bottom). According to our hypothesis (orange), gene expression variations in each initial cell can be predicted by measuring trichome distribution patterns.

