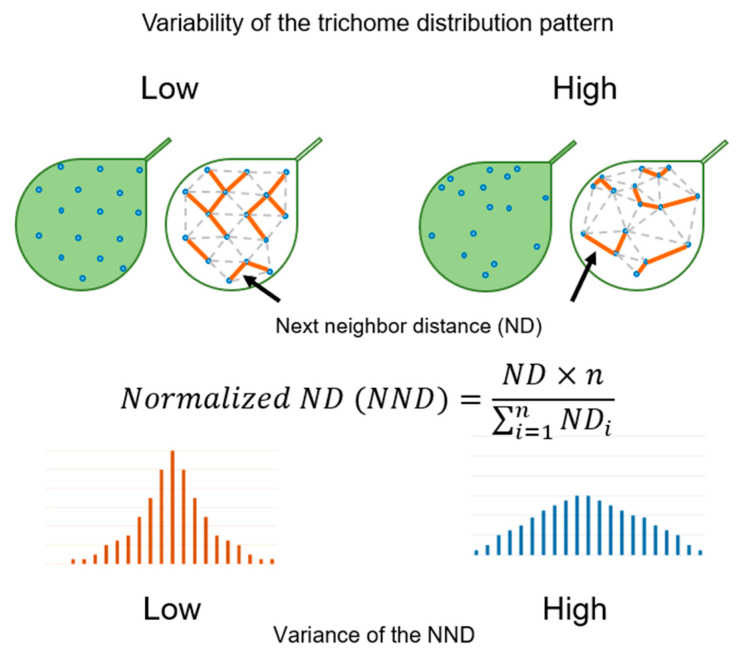
Figure 2.
Theoretical interpretation of the quantification of the trichome distribution pattern. The orange line indicates the shortest path between trichomes, referred to as next-neighbor distance (ND). The equation used to calculate the normalized ND (NND) is shown in the middle. The histogram of NNDs is shown at the bottom. High variability of the trichome distribution pattern demonstrates high variance of the NND distribution.

