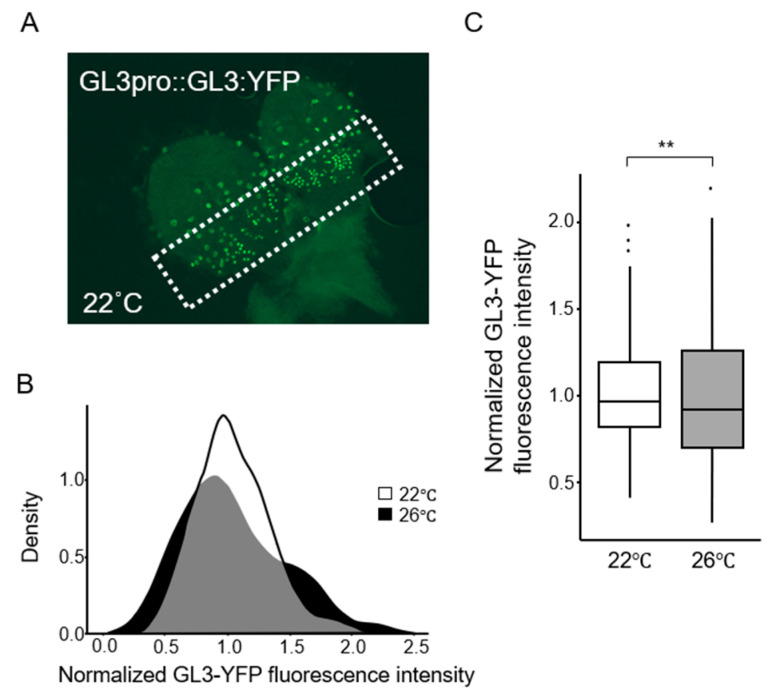
Figure 6.
Variations in GL3 protein level. (A) Representative image of GL3-YFP fluorescence signal. The GL3-YFP fluorescence intensity was measured from the area outlined by a white dotted line, which shows the initial cells in trichome development. (B) Distribution of GL3-YFP fluorescence in plants grown at 22 °C (white) and 26 °C (black). (C) Box plots of variances of intensities of normalized GL3-YFP fluorescence shown in panel B. ** p < 0.01.

