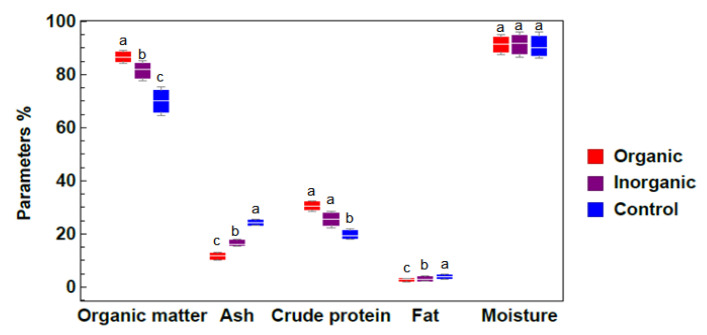
Figure 3.
Biochemical composition of Azolla sp. samples exposed to different treatments (means ± standard errors from three independent experiments under different treatments: organic, inorganic and control). Different lowercase letters indicate significant differences between different treatments at p ≤ 0.05.

