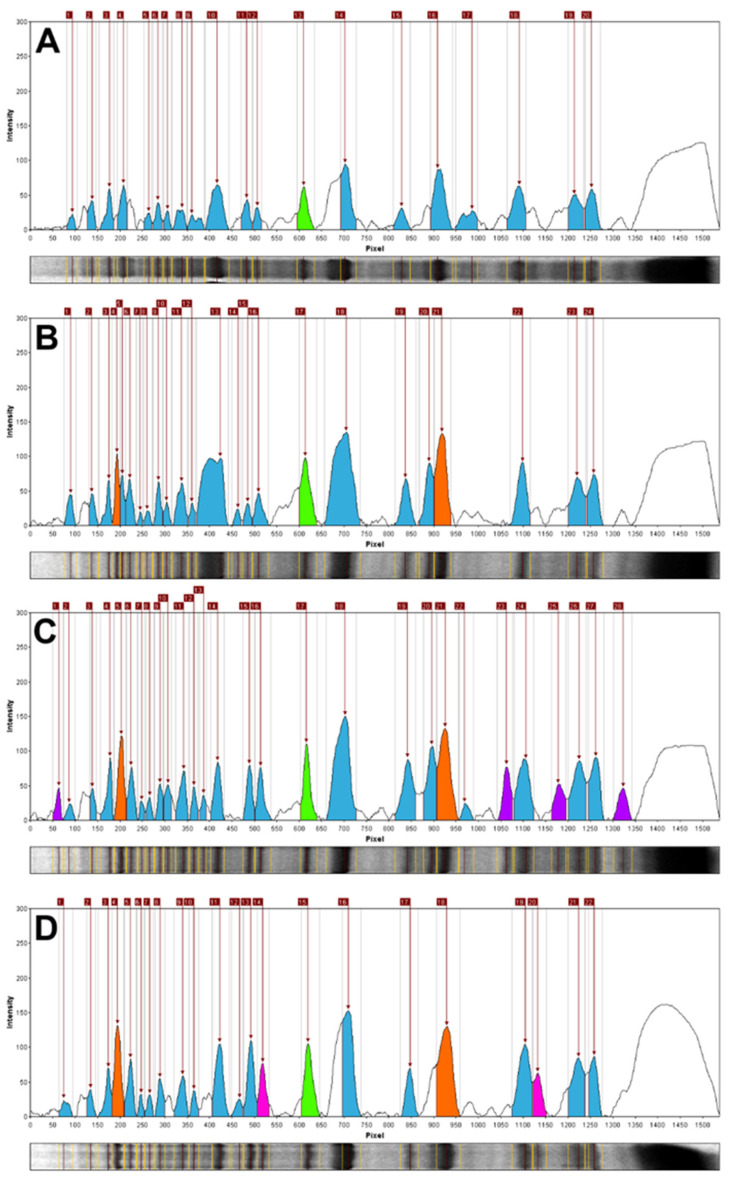
Figure 2.
Relative line image plots (densitograms) based on the STP profiling. (A): Pinus sylvestris, (B): Pinus × rhaetica, (C): Pinus uliginosa, and (D): Pinus mugo. Color code: orange—specific and semi specific bands for the Pinus mugo complex members (Rf = 0.13 and Rf = 0.60); green—a band specific to the Pinus section (Rf = 0.40; purple—diagnostic bands for Pinus uliginosa (Rf = 0.04, 0.69, 0.77, and 0.86); magenta—bands specific for Pinus mugo (Rf = 0.34 and 0.74); blue—represents the other bands identified in the given profile.

