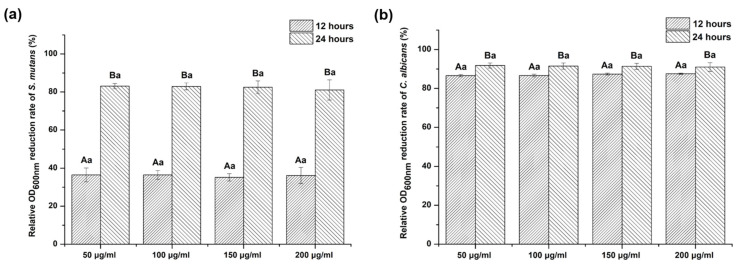
Figure 3.
Relative optical density (OD600nm) value reduction rate of (a) Streptococcus mutans and (b) Candida albicans exposed to Glycyrrhiza uralensis extract with concentrations of 50, 100, 150, and 200 µg/mL at two different times. The same lowercase letters show no significant difference in relative OD600nm reduction rate between the experimental groups at each time point (p > 0.05). The different uppercase letters indicate significant differences in relative OD600nm reduction rate between 12 and 24 h for each experimental group (p < 0.05).

