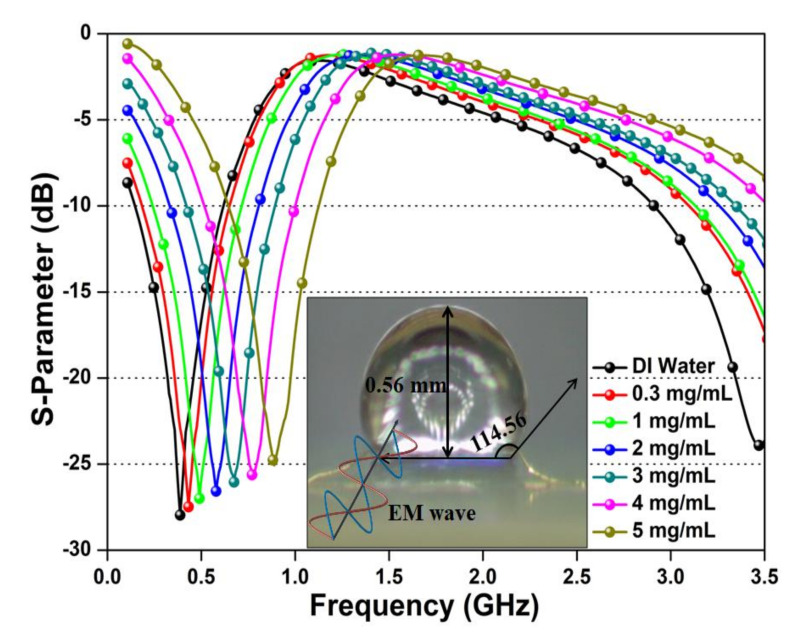
Figure 5.
Measured center frequency shift and amplitude variation of micro-fabricated microwave biosensor after interaction of glucose–water solution with different concentrations (0.3–5 mg/mL), the inset image represents the optical microscopic image of the dropped glucose–water sample with hydrophobicity analysis located at the sensing region.

