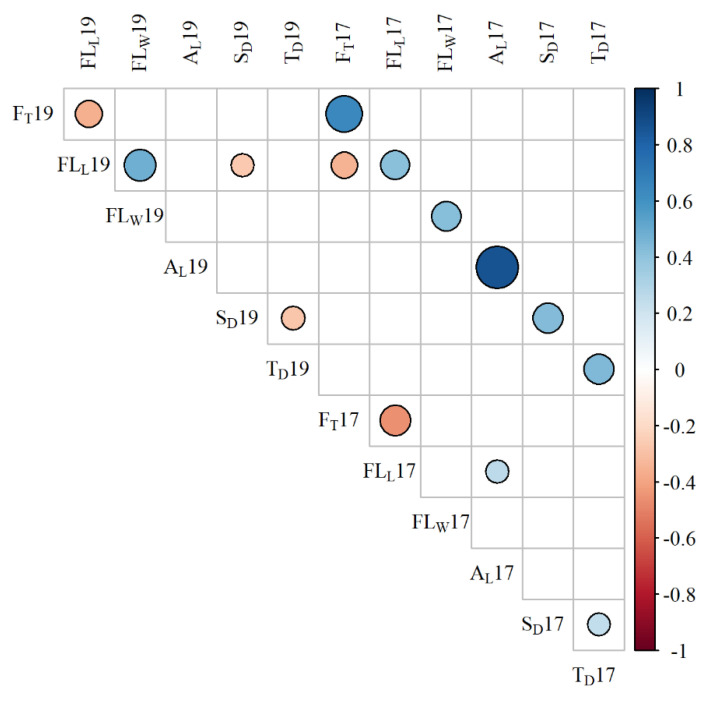
Figure 1.
Pearson’s correlation matrix for the 6 traits measured across both trials. Where a square is blank, the Pearson’s product moment correlation test yielded a non-significant p-value (p > 0.01). AL = awn length; FT = flowering time; FLL = flag leaf length; FLW = flag leaf width; SD = flag leaf stomatal density; TD = flag leaf trichome density. The correlation matrix was formed in R using the package corrplot [31]. Plot font was edited using the R package extrafont [32].

