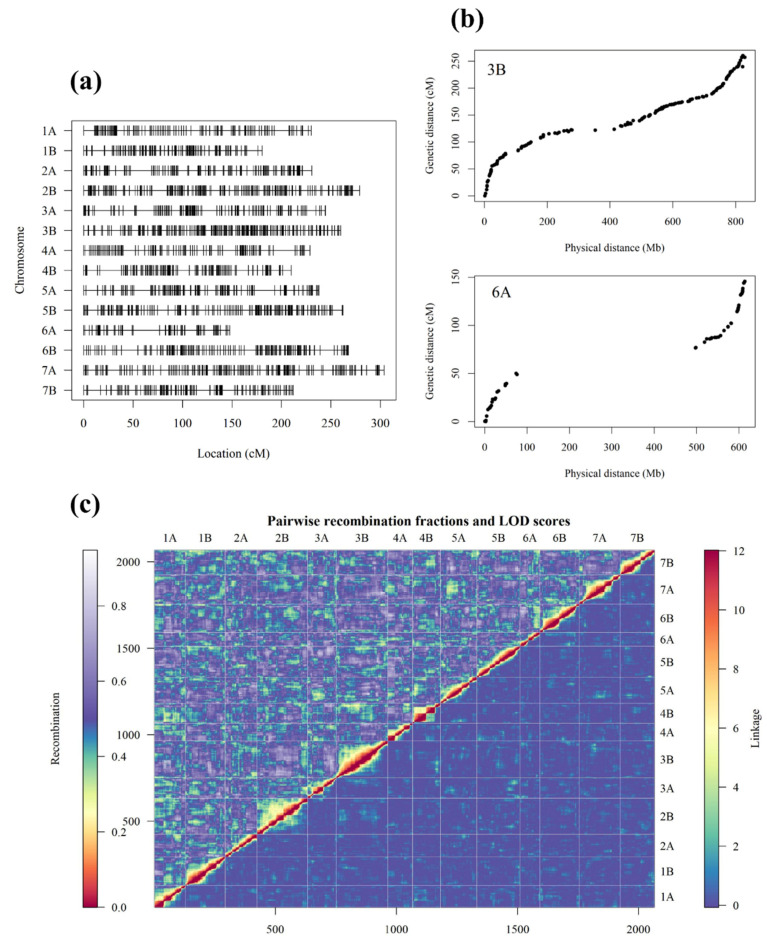
Figure 2.
(a) The genetic map created for the tetraploid mapping population (PS1) showing marker spacing across 14 chromosomes, formed using the packages ASMap [33] and R/QTL [34] in R. The map was created using 2066 single nucleotide polymorphism (SNP) markers and 104 individuals. The vertical line on each chromosome represents the mapped position for each SNP. (b) The genetic mapped position of each SNP in the new map is shown relative to the physical position obtained through Basic Local Alignment Search Tool (BLAST+) searches of the RefSeq v1.0 wheat genome assembly [35] for two chromosomes: 3B and 6A, which showed the highest and lowest marker frequency, respectively. (c) A heat map showing the assembled PS1 linkage map. The logarithm-of-odds (LOD) linkage between ordered markers is plotted in the bottom corner and pairwise recombination fractions between ordered markers is shown in the upper triangle, the heat map was created using the ‘heatMap’ function in ASMap [33]. Plot fonts were edited using the R package extrafont [32].

