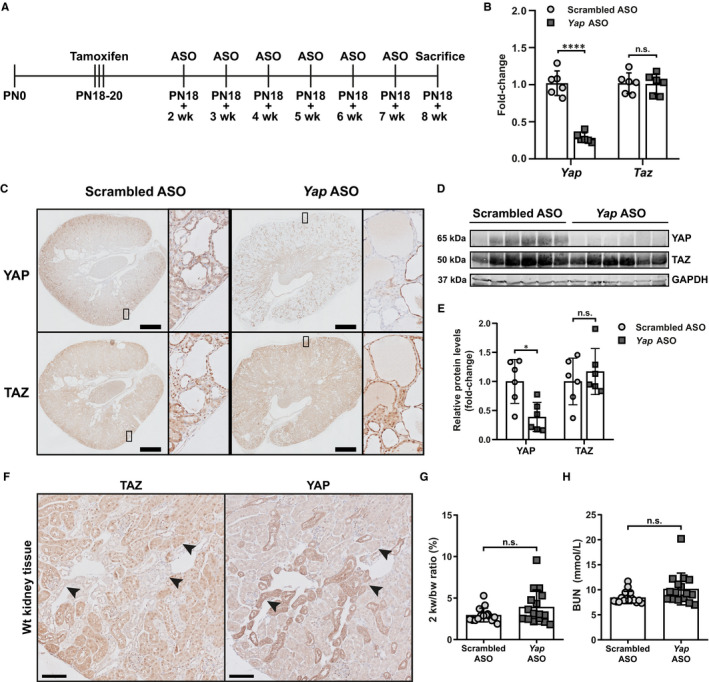
Figure 1.

In vivo down‐regulation of Yap with ASOs. A, Schematic representation of the in vivo experimental pipeline. Pkd1 gene inactivation was achieved with three consecutive administrations of tamoxifen at post‐natal day 18 (PN18). Two weeks after gene inactivation, mice were injected weekly intraperitoneally with Yap‐specific ASO or scrambled ASO as control. The last ASO injection was performed at 7 weeks after gene inactivation, and the mice were sacrificed one week later (+8 wk). B, Gene expression (fold change) of Yap and Taz at the sacrifice in mice treated with Yap ASO and scrambled ASO. Each symbol represents a mouse. Mean with ± SD. **** P < .0001, t‐test. C, Representative IHC of renal tissue from mice treated with scrambled ASO and Yap ASO, showing YAP and TAZ. Scale bar 1 mm. D, Total kidney protein lysates of mice treated with scrambled ASO and Yap ASO blotted for endogenous YAP, TAZ and GAPDH. E, Quantification of YAP and TAZ protein level in total kidney normalized on GAPDH. Each symbol represents a mouse. Mean with ± SD. * P < .05, n.s. not significant, t‐test. F, Representative YAP and TAZ IHC on sequential slides of Wt mice kidneys at post‐natal day 100. Arrowheads show the same tubules stained for the two different proteins. Scale bar 200 µm. G, Quantification of kidney size using two kidney weight/bodyweight ratio. n.s. not significant. H, Blood urea nitrogen (BUN) level at the sacrifice. n.s. not significant
