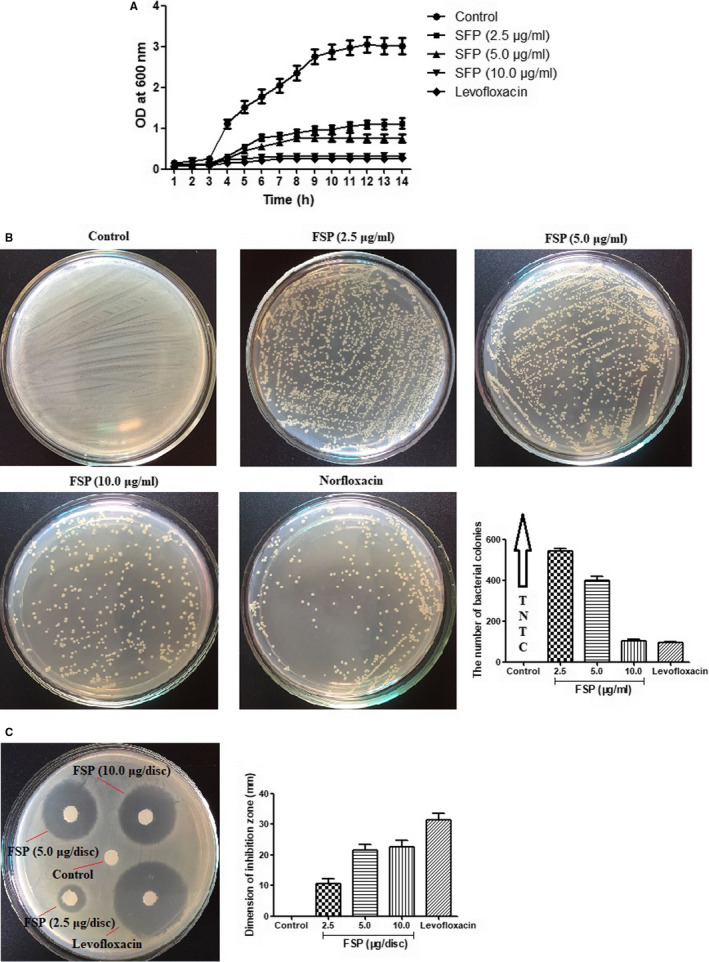
FIGURE 3.

In vitro antibacterial analysis of the polysaccharide. A, Bacterial growth curve of SHV‐12 ESBL‐positive Enterobacter cloacae in LB media in the presence of FSP (2.5, 5.0 and 10.0 μg/mL). B, Agar bioassay for SHV‐12 ESBL‐positive E cloacae in the presence of FSP (2.5, 5.0 and 10.0 μg/mL). C, Agar well diffusion assay for SHV‐12 ESBL‐positive E cloacae in the presence of FSP (2.5, 5.0 and 10.0 μg/mL). The mean ± SE for three replicates are illustrated
