FIGURE 4.

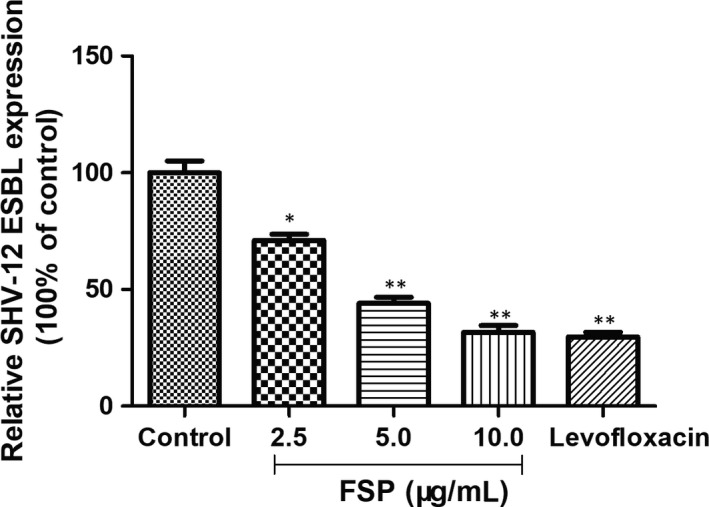
Relative mRNA levels of SHV‐12 ESBL in FSP‐treated Enterobacter cloacae strains measured by qRT‐PCR. The mean ± SE for three replicates are illustrated. * P < .05, ** P < .01 vs control

Relative mRNA levels of SHV‐12 ESBL in FSP‐treated Enterobacter cloacae strains measured by qRT‐PCR. The mean ± SE for three replicates are illustrated. * P < .05, ** P < .01 vs control