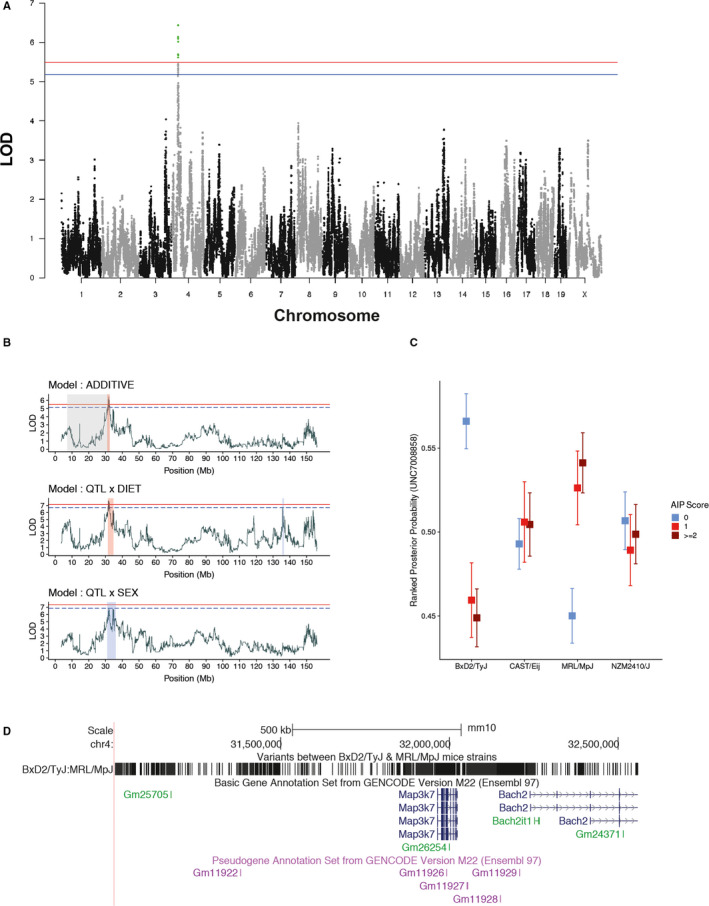
FIGURE 2.

Map3k7 is associated with experimental autoimmune pancreatitis (A) Manhattan plot for mapping of quantitative trait loci (QTLs) for murine autoimmune pancreatitis (AIP9. The plot shows chromosomes on x‐axis and LOD (log of odd ratios) for each SNP (grey and black dots) on y‐axis. LOD scores were calculated by regressing histological pancreatitis score with the estimated genotype posterior probability. Sex, diet and first principle component of kinship matrix were considered as additive covariate loci. Logarithmic p‐values are plotted against genome location. The red line represents the genome‐wide threshold (P < 0.05), and the blue line shows the suggestive threshold (P < 0.1) evaluated after 1000 permutations for histological pancreatitis score. (B) The scatter line plot shows LOD scores across chromosome 4 for three models (ie additive, interactive diet and sex). Use of either one of the interactive variables ('diet' or 'sex') considers the variability introduced by either of the variables, allowing to detect gene‐diet and gene‐sex interactions. The shaded region within the plot described confidence interval in Mb for each model (grey = AIP2, orange = genome‐wide and blue = chromosome‐wide). (C) The box plot shows ranked haplotype posterior probabilities (derived from happy R package using HMM) for Peak SNP (UNC7008858) across the four founder strains, when stratified for different AIP score. (D) The figure shows the fine‐mapped AIP2 loci (using UCSC browser) on chromosome 4 and genes within this loci. The figure also shows all the SNPs and Indels (derived from WGS) different between BxD2/TyJ and MRL/MpJ, as Peak SNP from these strains was negatively and positively correlated with AIP score in previous figure
