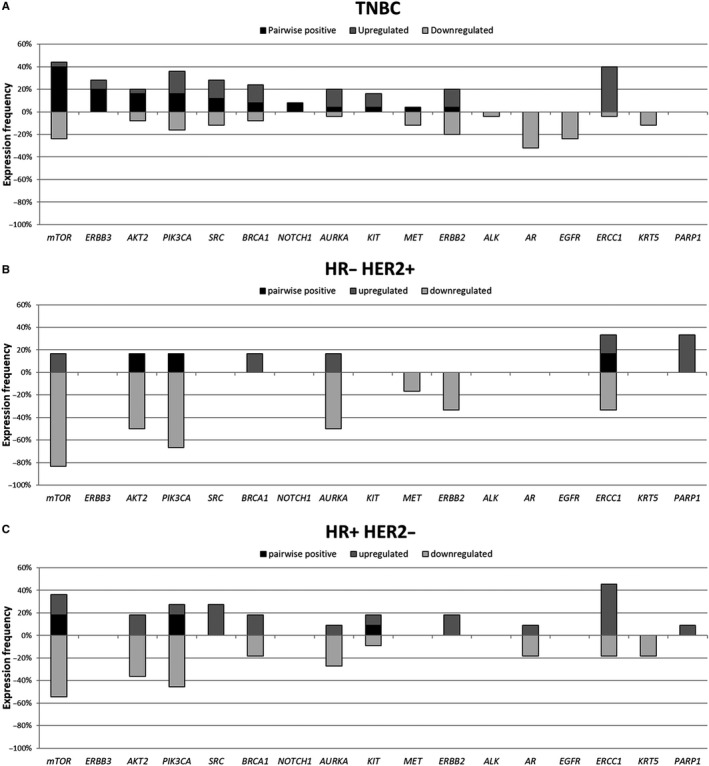
Figure 2.

Pairwise gene expression in all BC subgroups before and after therapy. A, TNBC. B, HR+/HER2− BC. C, HR−/HER2 + BC. In patients with TNBC (A), 11 (65%) of the 17 analysed genes were overexpressed at both time points, predominantly MTOR, ERBB3, AKT2 and PIK3CA. In the group of non‐TNBC patients, only 3/17 (18%) genes were detected BT as well as AT (MTOR, PIK3CA and KIT in the HR+/HER2− group (B) and PIK3CA, AKT2 and ERCC1 in the HR−/HER2+ (C) group, respectively). Although the number of analysed pairs in these two subgroups of non‐TNBC patients was quite small, in HR+/HER− patients, a comparable number of genes were differentially up‐ (n = 11) or down‐regulated (n = 9) whereas in the HR−/ HER2 + group, most of the genes expressed BT were down‐regulated AT (n = 7)
