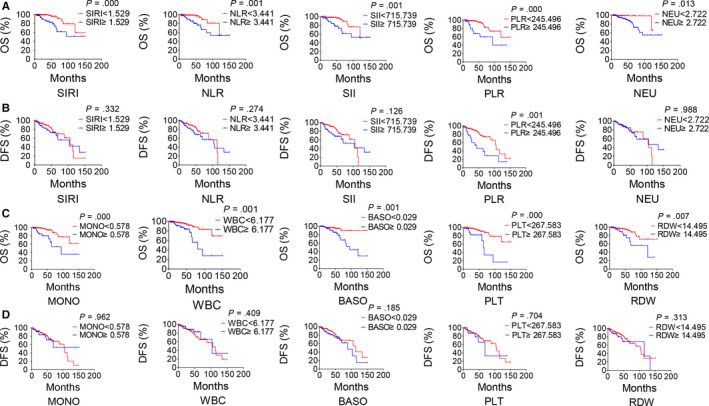
Figure 7.

Inflammation indicators predict survival in NPC. Estimated overall survival (OS) (A) and disease‐free survival (DFS) (B) curves for SIRI, NLR, SII and PLR. OS (C) and DFS (D) curves for MONO, WBC, BASO, PLT and RDW. Radiotherapy included radiotherapy alone or chemoradiotherapy
