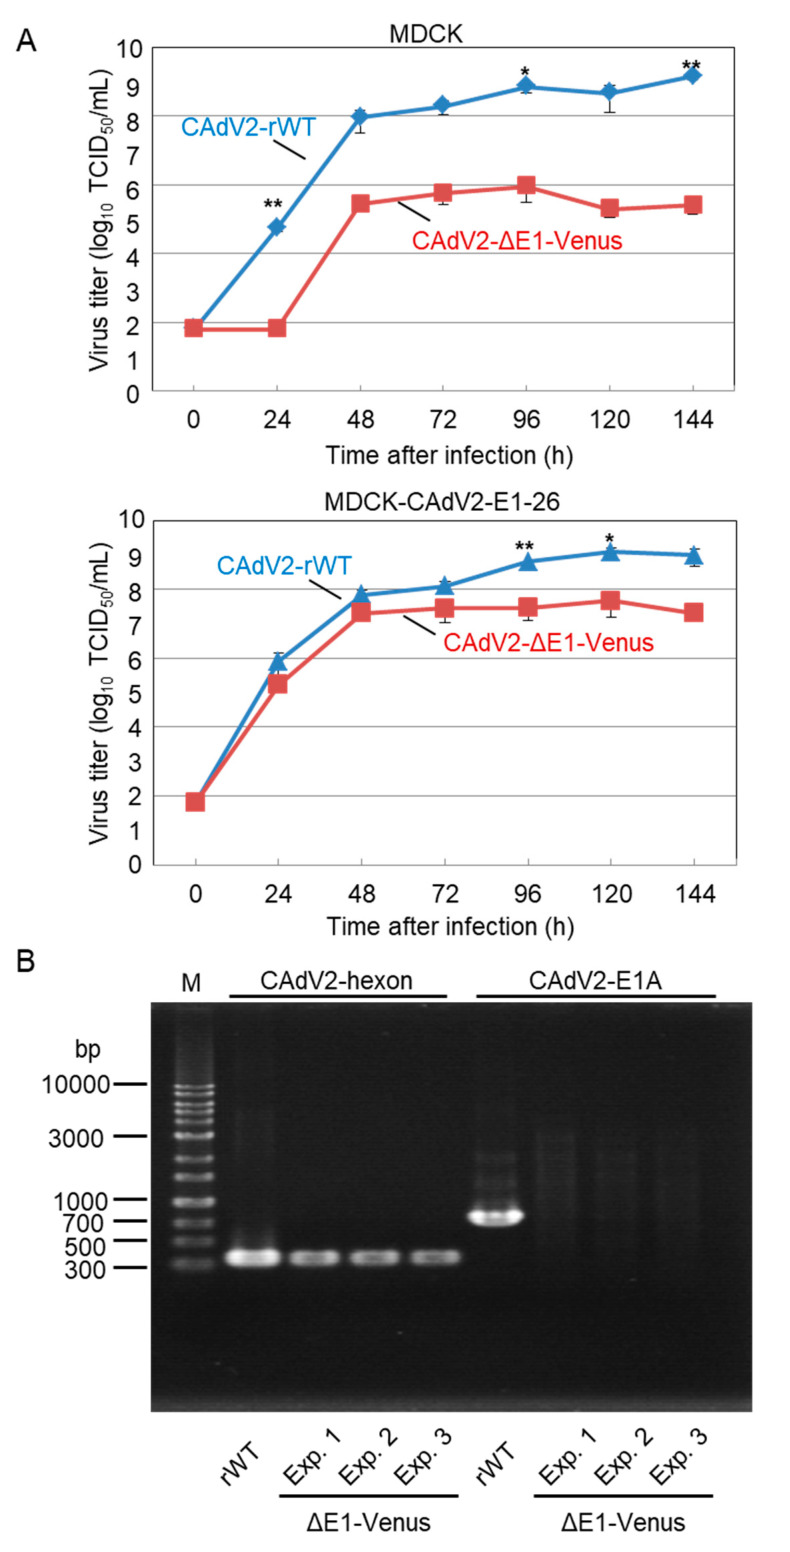
Figure 6.
Characterization of CAdV2-ΔE1-Venus. (A) Growth kinetics of CAdV2-WT and CAdV2-ΔE1-Venus. MDCK cells and MDCK-CAdV2-E1-26 cells were infected with CAdV2-WT or CAdV2-ΔE1-Venus at an MOI of 0.2. The culture supernatants were collected at the indicated time points, and the viral titers (TCID50/mL) were determined in MDCK-CAdV2-E1-26 cells. The results are reported as the mean titer with standard deviations for three independent experiments. The asterisks indicate significant differences (* p < 0.05; ** p < 0.01 by Student’s t-test). (B) Analysis of the CAdV2-rWT and CAdV2-ΔE1-Venus genomes. CAdV2-ΔE1-Venus was generated by three independent experiments (Exp. 1, 2, and 3). Viral DNA was extracted from CAdV2-rWT and CAdV2-ΔE1-Venus propagated in MDCK cells. PCR was performed using primers specific for the CAdV2 hexon and E1A genes. M: 1-kb DNA ladder marker.

