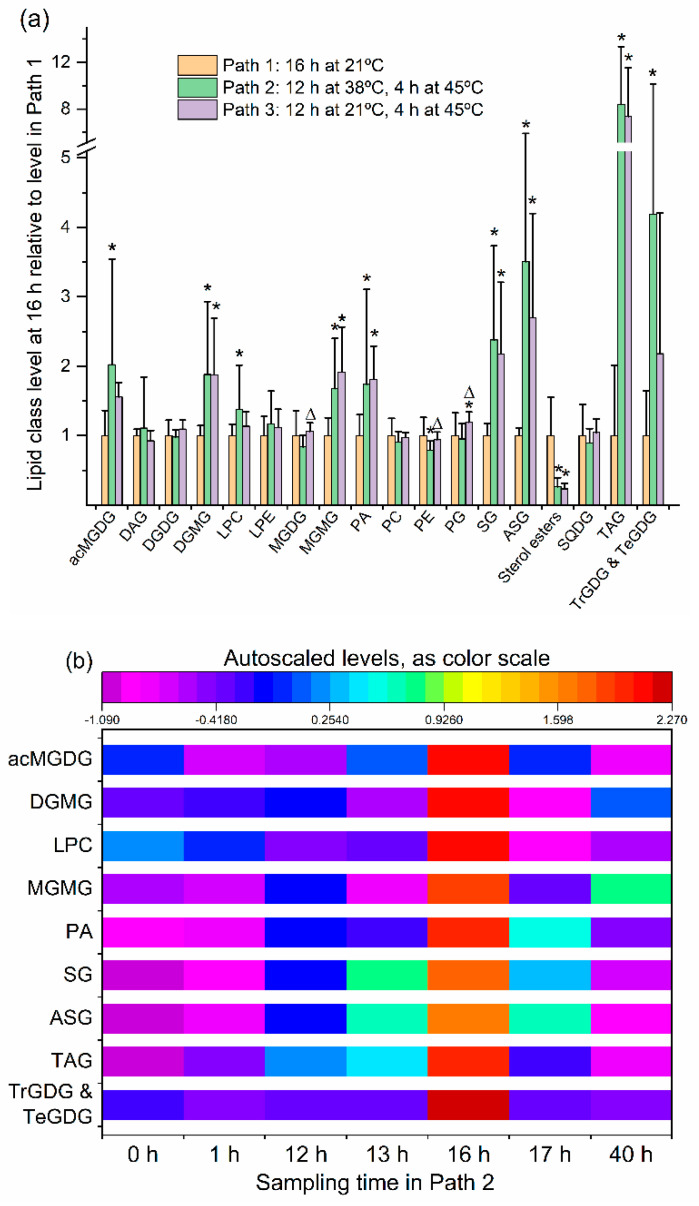
Figure 2.
Levels of lipid head group classes in Arabidopsis leaves at the end of the heating treatment, compared to plants at 21 °C, and Path 2 lipid class time course. (a) Levels of lipid head group classes at the end of the heating treatment (16 h time point) in Path 2 (12 h at 38 °C and 4 h at 45 °C) and Path 3 (12 h at 21 °C and 4 h at 45 °C), relative to level at same time point in Path 1 (16 h at 21 °C). Asterisks indicate a significant difference in lipid level in Path 2 or 3 (by comparison with Path 1). Triangles indicate a difference of Path 3 from Path 2. Differences were evaluated by one-way ANOVA with Tukey’s multiple comparisons test, adjusted for FDR. A p value < 0.05, after correction for FDR, was considered significant. Error bars indicate standard deviation. (b) Heat map for lipid samples from the time course listing the nine lipid classes significantly increased in Path 2, based on autoscaled values for each lipid (see Section 3).

