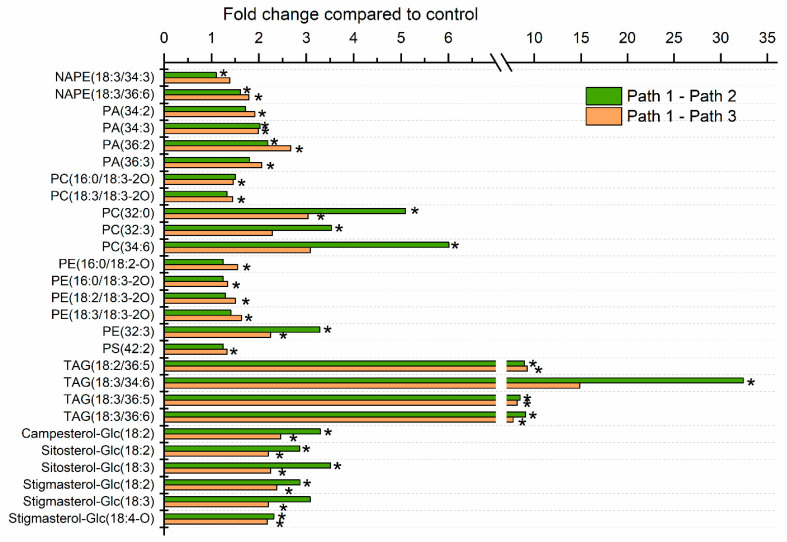
Figure 5.
Extra-plastidic leaf phospholipids, acyl sterol glucosides, and triacylglycerols, significantly altered by heat treatment. Values represent the level of each lipid under heat treatment over the level in control plants at 16 h after the start of the experiment. The control plants were continually subjected to 21 °C (Path 1), while Path 2 plants were subjected to 12 h at 38 °C plus 4 h at 45 °C, and Path 3 plants were subjected to 12 h at 21 °C plus 4 h at 45 °C. A mixed effects ANOVA model was fitted to the data, and pairwise comparisons were made between paths; p-values were adjusted for FDR. The lipid species shown were those significantly altered in Path 2 and/or 3 compared to Path 1, as indicated by asterisks.

