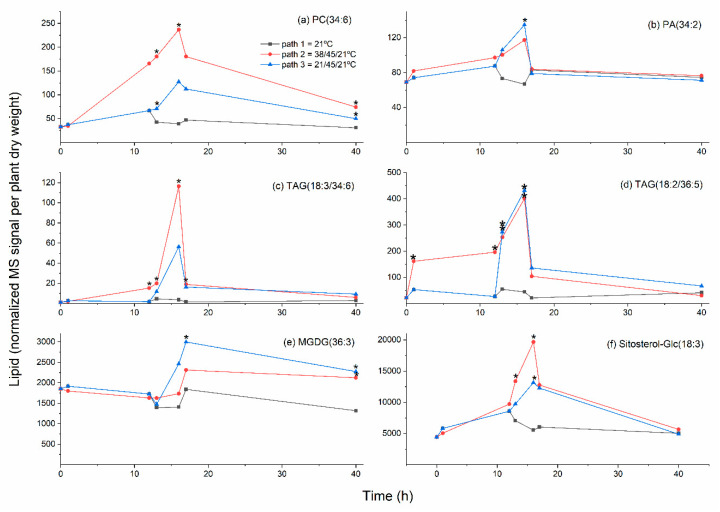
Figure 7.
Levels of additional lipid species as a function of time during control and heat stress treatments. Treatment details are shown in Figure 1. (a) PC(34:6); (b) PA(34:2); (c) TAG(18:3/34:6); (d) TAG(18:2/36:5); (e) MGDG(36:3); (f) Sitosterol-Glc(18:3). A mixed effects ANOVA model was fitted to the data, and pairwise comparisons were made between paths; p-values were adjusted for FDR. An asterisk indicates that the value is significantly different from the control (Path 1) value for that time point (p < 0.05), using a p-value adjusted for false discovery rate (FDR; Table S4).

