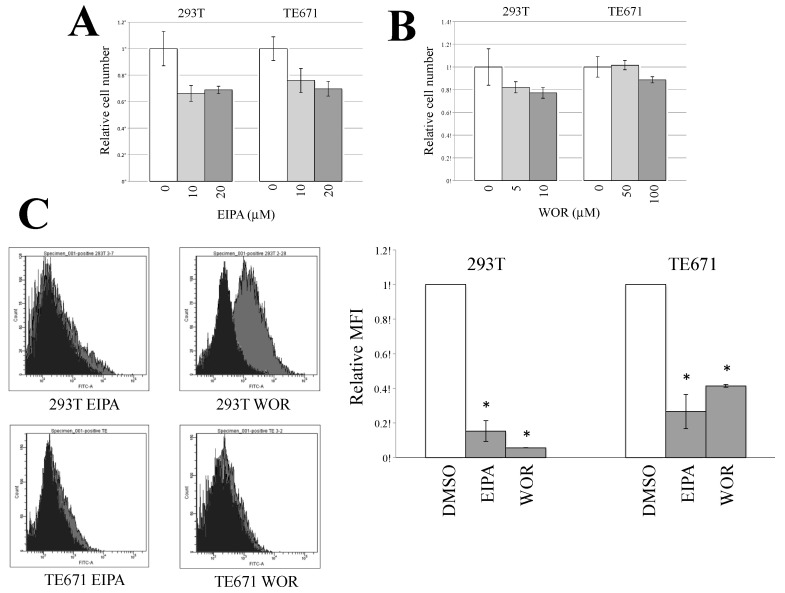
Figure 3.
Effects of macropinocytosis inhibitors on cell viability and macropinocytosis. (A and B) 293T and TE671 cells were treated with 5-(N-ethyl-N-isopropyl)-amiloride (EIPA) or wortmannin (WOR) for 5 h. The culture supernatants were changed to fresh medium without the inhibitors, and continued to be cultured for 24 h. Cell numbers were counted. This experiment was performed in triplicate. Relative values to numbers of cells treated with same volume of DMSO. Averages are shown. Error bars indicate standard deviations. Asterisks indicate statistically significant differences compared to the values in DMSO-treated cells. (C) Fluorescein isothiocyanate (FITC)-conjugated dextran (molecular weight >70,000) internalized into cells by macropinocytosis was measured using a flow cytometer (left panel). Relative values to the means of fluorescence intensities (MFIs) in DMSO-treated cells are indicated (right panel). MFIs in the DMSO-treated cells are always set to 1. This experiment was repeated in triplicate, and averages are shown. Error bars indicate standard deviations. Asterisks indicate statistically significant differences compared to the values in DMSO-treated cells.

