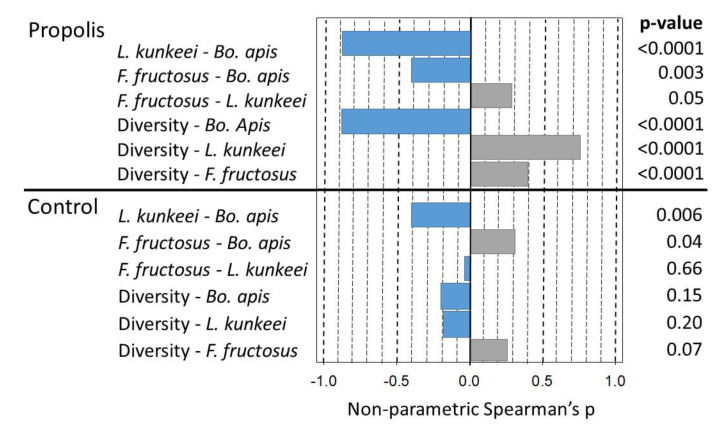
Figure 3.
Spearman’s correlations comparing treatments, the absolute abundance of operational taxonomic units (OTUs), and the microbiome diversity. Treatments are propolis and the control (no propolis). The pairwise species correlations depict a positive (gray) or negative (blue) association between the absolute abundance of each species. The mouthpart microbiome diversity is calculated as inverse Simpson’s, which increases with numerical values. Therefore, positive correlations between species and diversity (in gray) depict a greater absolute abundance of species associated with an increased mouthpart diversity. Negative correlations (in blue) depict a lower species absolute abundance associated with an increased mouthpart diversity.

