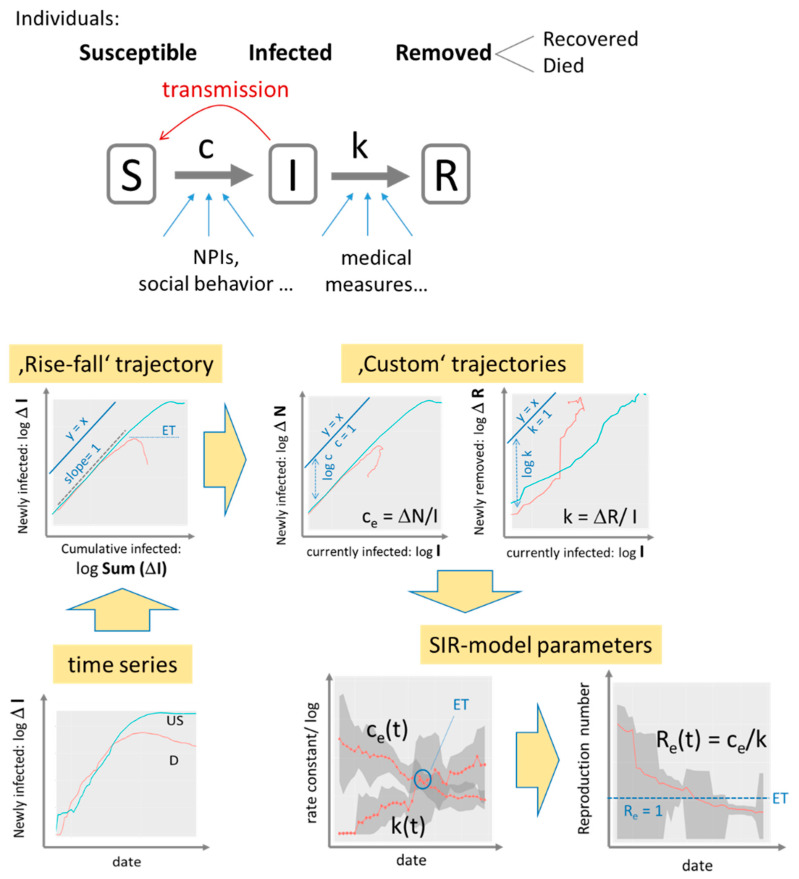
Figure 3.
SIR model analysis: The SIR model assumes a sequence of three disease states (S, I, R, S + I + R = N, N population size) and transitions between them. Transmission and removal rates (numbers per day) are quantified in terms of the rate constants c and k, respectively. The time series of infected cases transforms into trajectories, which show daily changes of infected and removed cases as a function of cumulated or current infections in double logarithmic scale. Exponential growth is indicated by slope of unity while the transmission and removal rate factors refer to the vertical distance between the respective trajectory and the diagonal line (y = x). A downwards curved trajectory indicates decreased growth or eradication of epidemic (slope < 0) with the epidemic threshold (ET: slope = 0) indicating stop of epidemic. Values of the factors ce and k and of the reproduction number Re are plotted as a function of date as running averages over a sliding window of seven days (the running standard deviation is shown as grey uncertainty strip). Example data are shown for Covid-19 case numbers in Germany (D, red curves) and USA (US, blue) from 27 April 2020. See text and Supplementary File, Appendix I and II for details.

