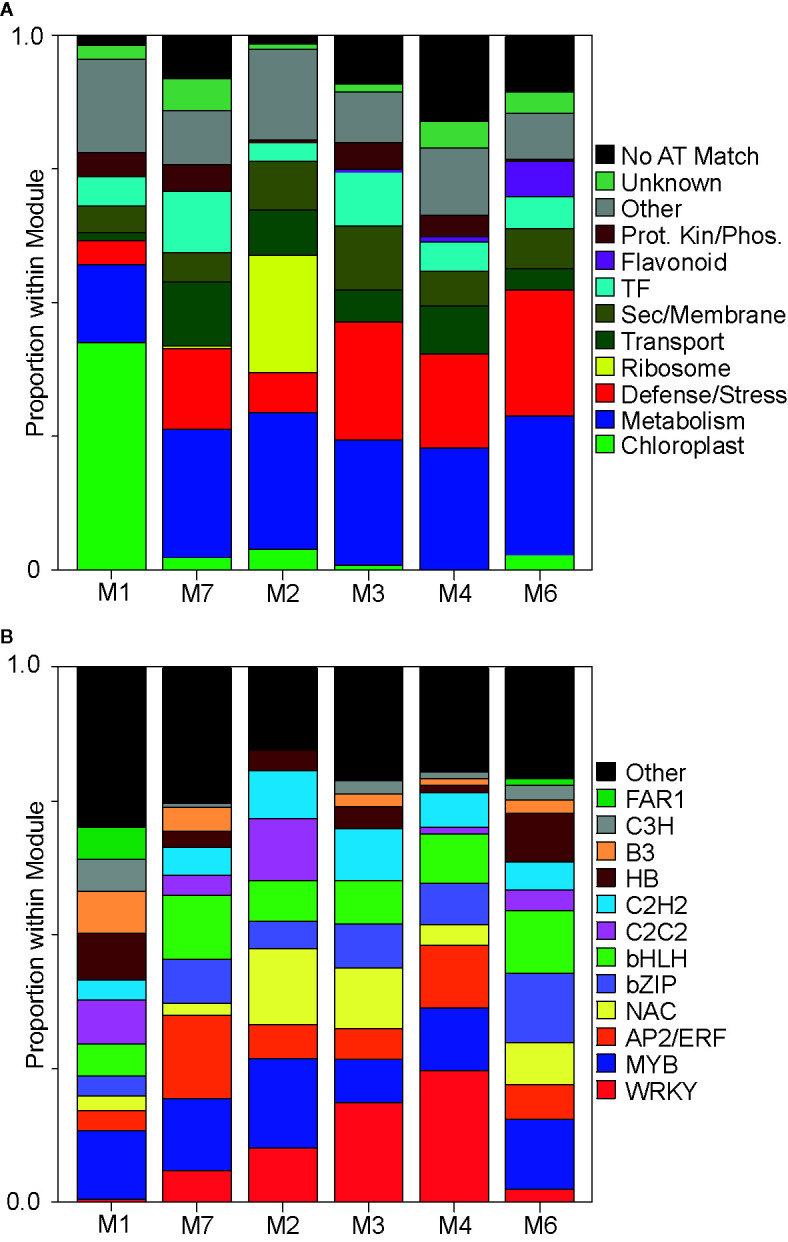
Figure 2.

Functional classification of genes within each co-expression module. (A) Proportional distribution of the ~top 200 genes within each module. Proteins encoded by these ~top 200 genes were manually assigned into predicted cellular functions. Proteins whose functions were ambiguous were grouped into “other” category, (black color). Assigned functional classifications are in colored boxes to the right of panel (see Data S1 ). (B) Transcription factor abundances in the top ~10% of all genes present within each module. Encoded proteins were grouped into known plant transcription factor families [PlantTFDB, http://planttfdb.gao-lab.org/index.php?sp=Pvi (Jin et al., 2017)], which are color coded and shown to the right of panel (also see Data S1 ).
