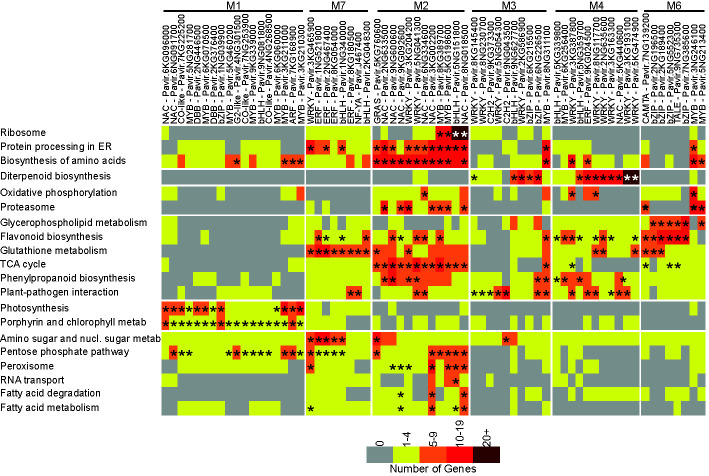
Figure 3.
Target TF subnetwork analysis. Modules and target TFs with family and gene id. are shown at the top of the figure. KEGG pathways showing subnetwork enrichment are shown on the left. The number of genes associated with individual TFs in each KEGG pathway are color coded, from gray – no genes to brown – >20 genes. Asterisks denote significant enrichment within the subnetwork at P ≤ 0.05.

