Figure 6.
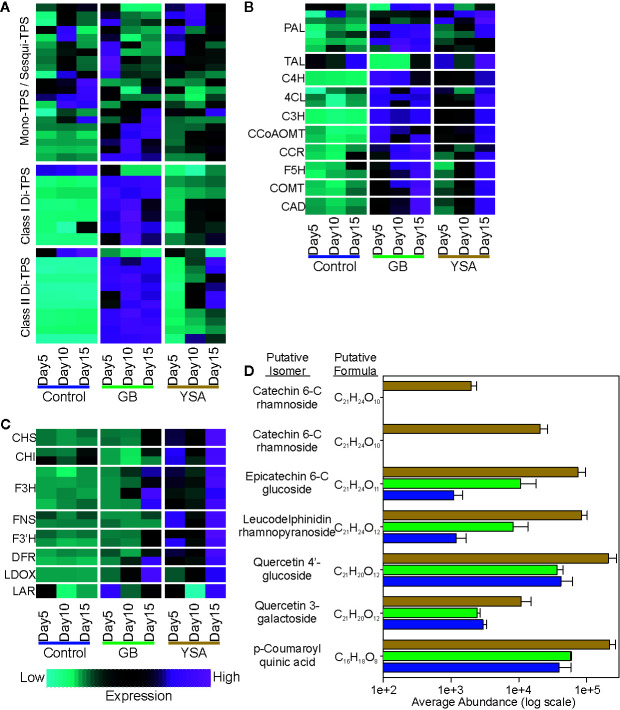
Expression heat maps of select genes associated with biosynthesis of secondary metabolites. Maps are based on z-scores of DEGs where cyan is low expression and magenta is high expression. (A) Terpene synthases (TPS). (B) Phenylpropanoid pathway genes. (C) Flavonoid and anthocyanin pathway genes. (D) Abundance of putative flavonoids in plant tissues at 15DAI. Blue bars, control plants; green bars, GB infested plants; gold bars, YSA infested plants. Gene lists are provided in Data S1 .

