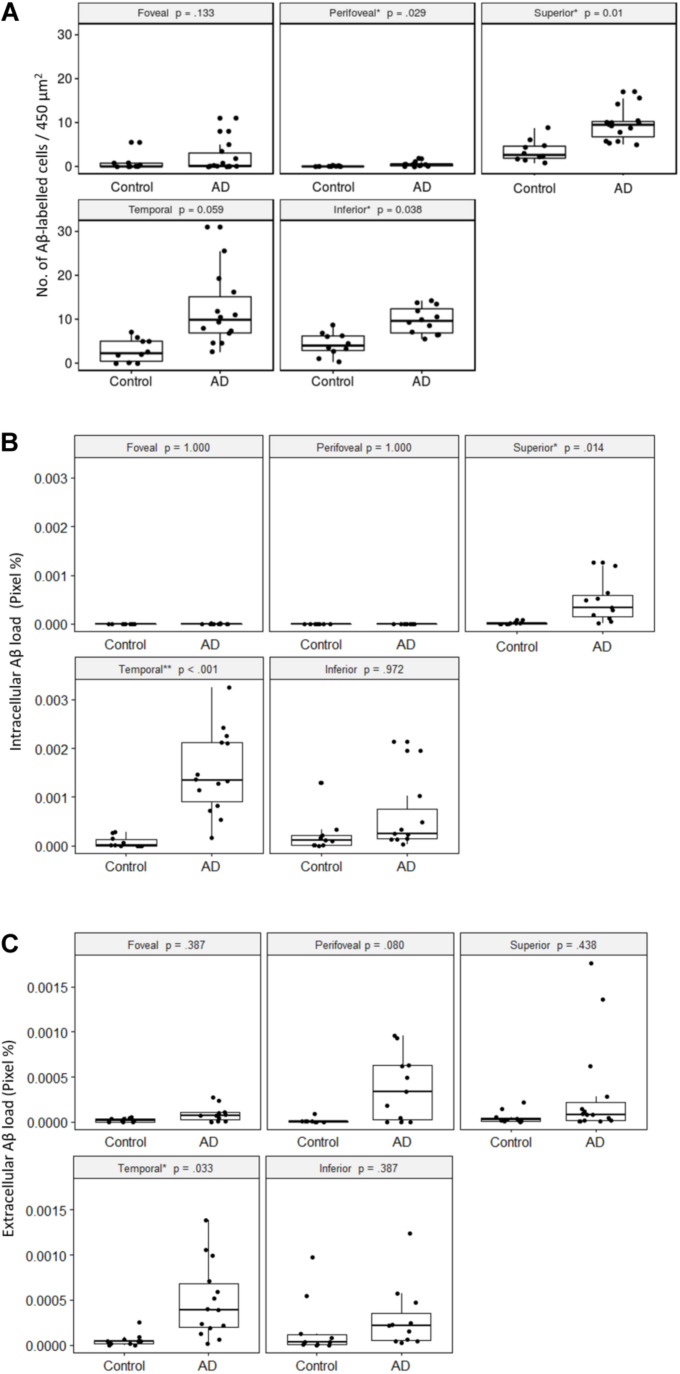
FIGURE 6.
Comparisons of Aβ-labeling between control and AD groups. (A) Number of Aβ-labeled cells in the retinal ganglion cell layer. The AD subjects had significantly greater numbers of Aβ-labeled cells than the controls in the peri-foveal, superior, and inferior regions, using age-adjusted robust ANCOVA. (B) Intracellular Aβ load in the retinal ganglion cell layer. The AD subjects had significantly greater intracellular Aβ load than the controls in the superior and temporal regions using age-adjusted robust ANCOVA. (C) Extracellular Aβ load in the retinal ganglion cell layer. The AD subjects had significantly greater extracellular Aβ load than the control in the temporal region using age-adjusted robust ANCOVA.

