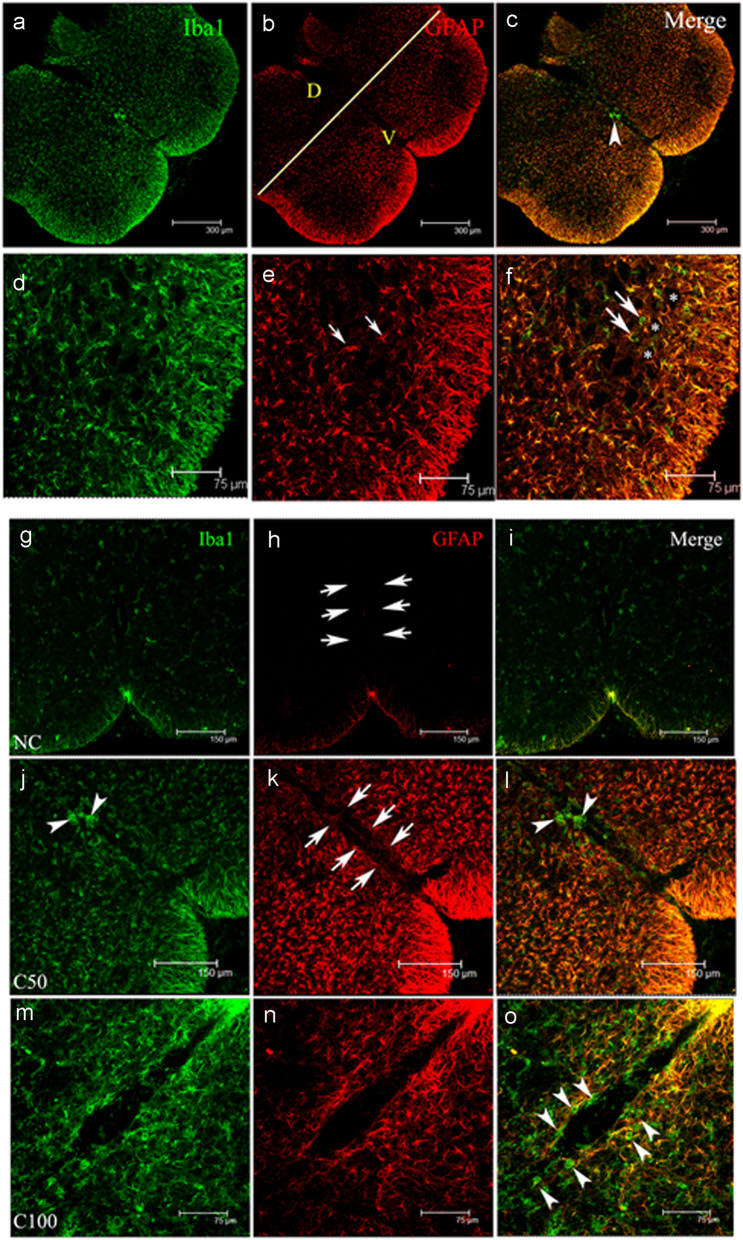
Fig. 4.
Effect of CHIT-1 on glia in different regions of the spinal cord. Representative confocal micrographs showing Iba1 (green) and GFAP (red) expression in the spinal cord sections (a–f). Significant amount of gliosis was noted in the ventral horn (V) compared to dorsal horn (D). The yellow coloured line demarcates the areas (b). The higher magnification images show the presence of astrocytes (red, small arrows, (e)) in the grey matter and also the Iba1 (green, big arrows, (f)) immunoreactive microglia surrounding the motor neurons (*). Scale bars are indicated. Representative confocal photomicrographs showing Iba1 (green) and GFAP (red) expression around the central canal (arrows) (g–o). Note the faint staining in normal control (NC, (g, h, i)) whereas both the markers show upregulation in the 50 and 100 pg concentrations of CHIT-1 (C50 and C100) (j–o). Note the presence of amoeboid shaped microglia within the vicinity of the canal (arrowheads) (o). Scale bars are indicated

