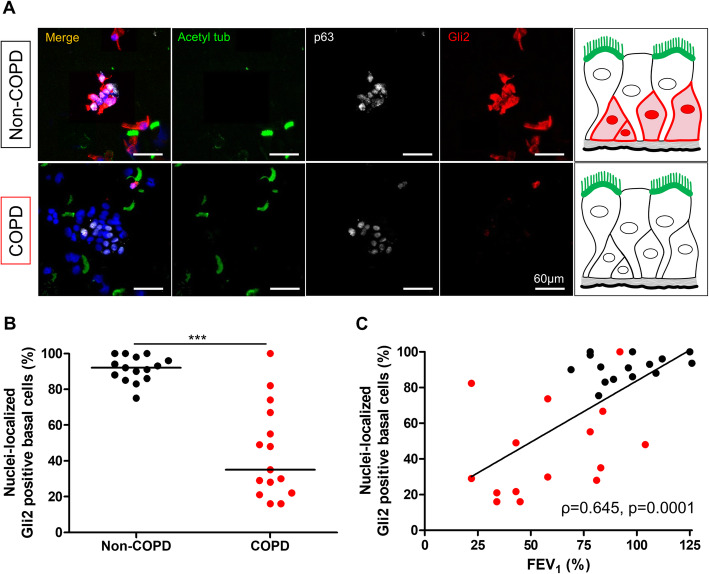
Fig. 3.
Gli2 expression is decreased in airway progenitor basal cell nuclei from COPD patients. a. Representative micrograph showing a ROI of a bronchial brushing stained for cilia (Acetylated tubulin, green); Gli2 (Gli2, red); basal cells (p63, white) and cell nuclei (DAPI, blue) in both non-COPD (upper panel) and COPD patients (lower panel). Magnification corresponding to the selected area is shown. Insets depict localization of the Gli2 transcription factor. b. Dot plot with median showing the percentage of Gli2-positive basal cell nuclei in non-COPD (n = 15) and COPD patients (n = 15). ***, p < 0.0001. c. Linear regression of the percentages of Gli2-positive basal cell nuclei according to FEV1 (% predicted) for non-COPD (n = 15) and COPD patients (n = 15). Non-COPD patients are represented by black circles and COPD patients are represented by red circles

