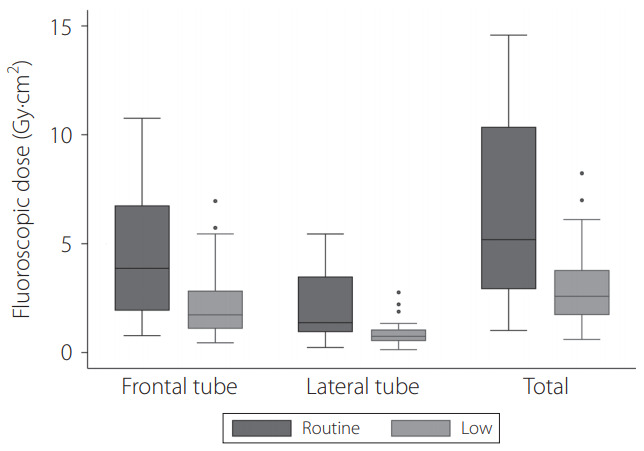
Fig. 2.

Box plots of fluoroscopic dose (kerma-area product) between routine and low dose groups for each tube. The top of the box represents the 75th percentile, the bottom of the box represents the 25th percentile, and the line in the middle represents the 50th percentile. The whiskers represent the highest and lowest values that are not outliers or extreme values. Circles beyond the whiskers represent outliers and extreme values.
