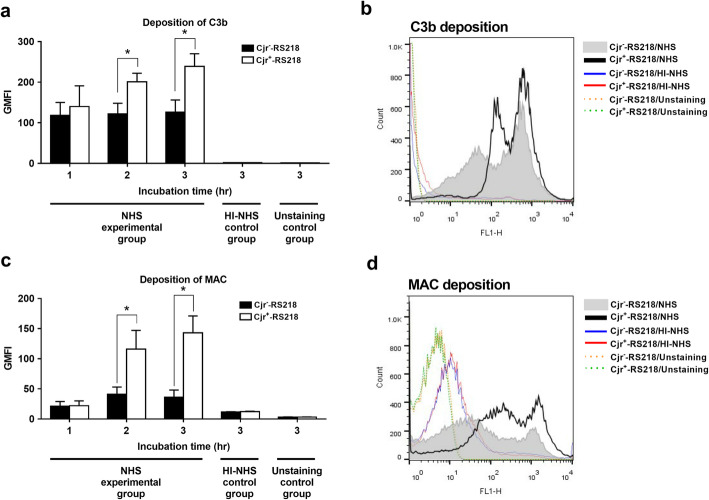
Fig. 2.
Deposition of C3b and MAC on Cjr+-RS218 and Cjr−-RS218 in 40% NHS for various periods. (a) Levels of C3b deposition on Cjr+-RS218 and Cjr−-RS218 after incubation with NHS for the indicated time periods. (b) Flow cytometry histogram of C3b deposition on the bacteria after 3 h of incubation in NHS. (c) Levels of MAC deposition on Cjr+-RS218 and Cjr−-RS218 after incubation with NHS for the indicated time periods. (d) Flow cytometry histogram of MAC deposition on the bacteria after 3 h of incubation in NHS. For (a) and (c) The data are presented with geometric mean fluorescence intensity (GMFI). The HI-NHS control groups were bacteria incubated in HI-NHS, while the unstaining control groups were the bacteria without fluorescence staining. The results are shown as the means ± standard deviations, and the data are representative of three independent experiments performed in triplicate. *, P value < 0.05

