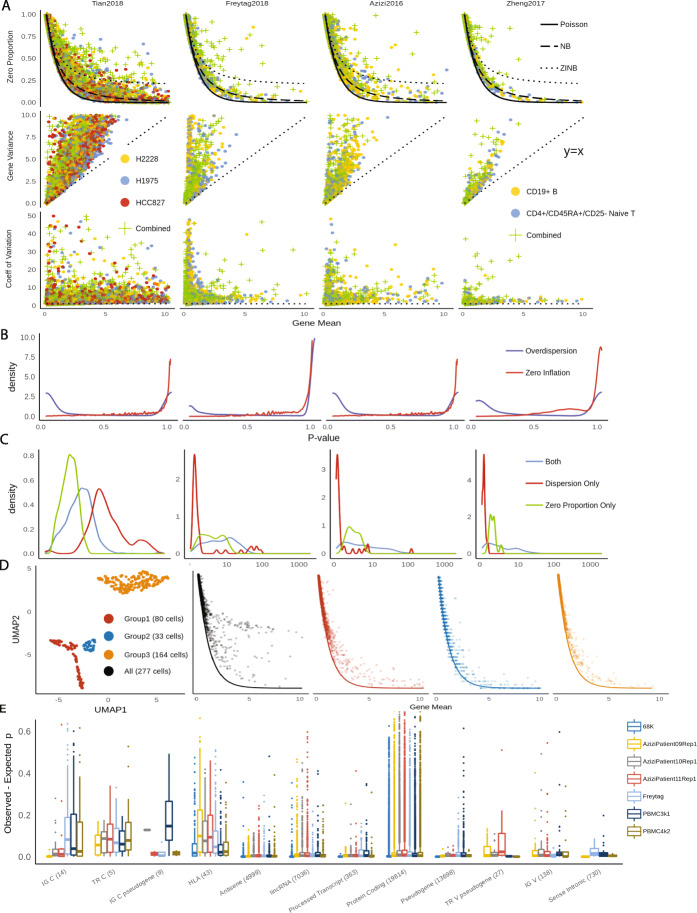
Fig. 1.
a Comparisons of zero proportion, gene variance, and CV as indicators for cellular heterogeneity in different UMI data sets. b Distributions of p values from likelihood ratio test for over-dispersion and zero-inflation. c Comparisons feature selection using likelihood ratio test and zero proportions. LR test tends to select the genes that have mean UMI count close to 0. d t-SNE plots of CD34+ cells in Zheng data, and relationship between zero proportions and gene means before (black) and after (colors) clustering of CD34+ cells. e Distributions of zero inflation in different PBMC data sets. The x-axis labels represent gene types from GENCODE annotations and the number of genes within each type

