
FIGURE 1.
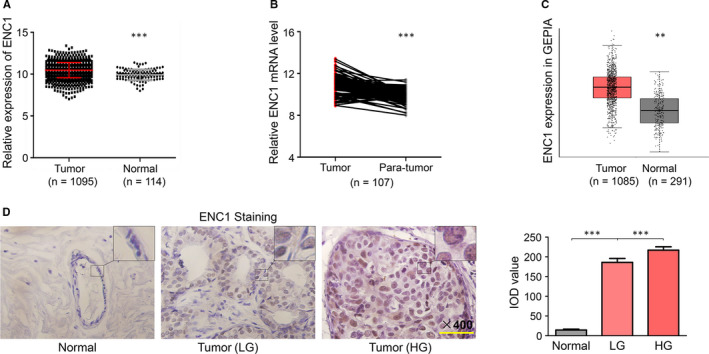
ENC1 expression is increased in breast cancer. A, ENC1 expression in breast cancer (tumour) and normal breast tissues (normal) in TCGA dataset. B, ENC1 gene expression was significantly higher in breast cancer (tumour) compared with matched non‑neoplastic breast tissues (para‐tumour) in TCGA dataset. C, ENC1 expression in breast cancer (tumour) and normal breast tissues (normal) in GEPIA online tools. Immunohistochemical staining was performed to detect ENC1 expression in breast cancer with different grades (low grade: LG, high grade: HG) and normal breast specimens. Representative ENC1 staining was shown, and IOD value was used to quantify the results. The experiments were performed and calculated in triplicate (N = 3). Scale bars, 200 µm. (D)