
FIGURE 3.
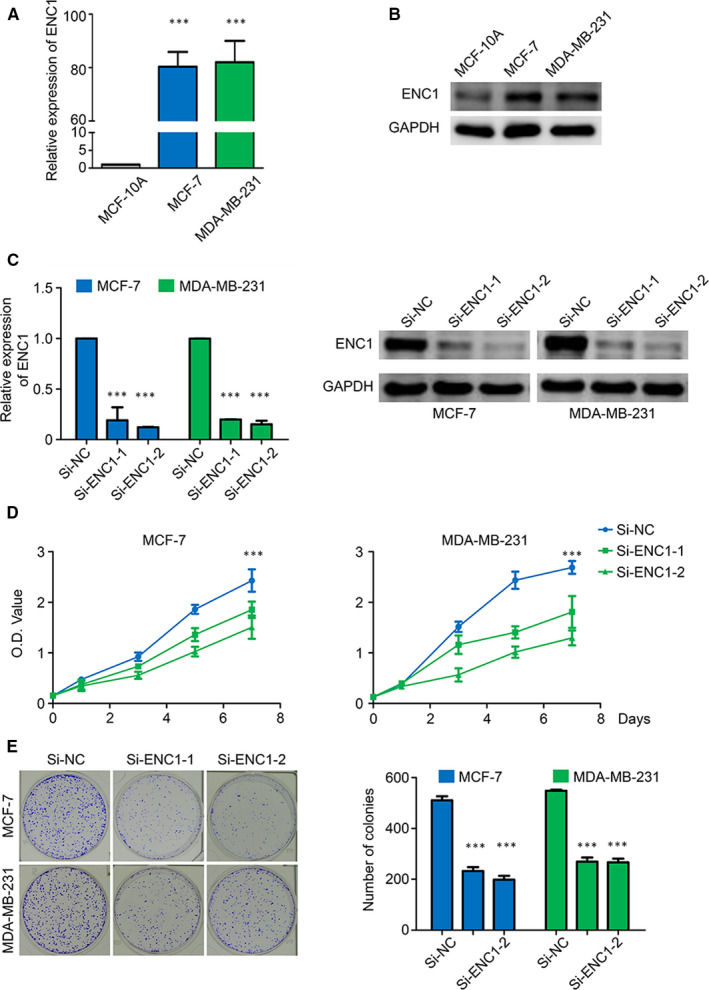
ENC1 enhances the proliferation properties of breast cancer cells. The ENC1 expression in different cell lines was demonstrated by qRT‐PCR (A) and Western blot analysis (B). Knockdown of ENC1 mRNA with two different siRNAs (si‐ENC1‐1 and si‐ENC1‐2) in MCF‐7 and MDA‐MB‐231 cells was demonstrated by RT‐qPCR and Western blot analysis. The 18S RNA was used as a normalized control for RT‑qPCR assay, and GAPDH was utilized as a loading control for Western blot analysis (C). (D) ENC1 knockdown significantly inhibited cell viability. (E) ENC1 knockdown significantly inhibited colony formation of breast cancer cells. The representative images of colony formation in cells transfected with the indicated siRNAs are shown. The experiment is repeated and calculated in triplicate (N = 3). Data are presented as mean ± standard deviation. ***P < 0.001