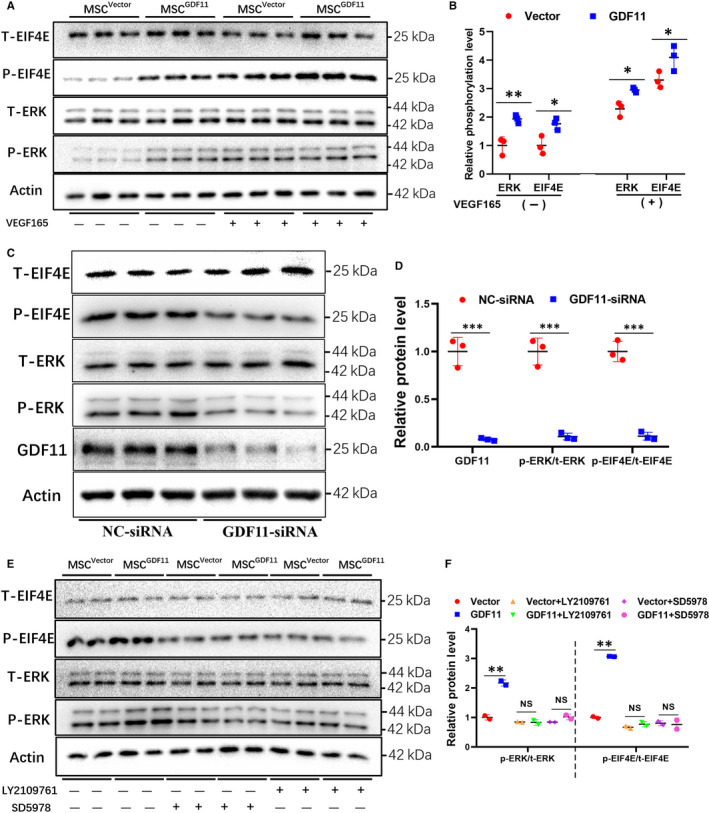
FIGURE 6.

Analysis of the molecular pathways underlying GDF11‐induced MSC differentiation. A, MSCsVector and MSCGDF11 were cultured in the presence or absence of VEGF165 for 14days. Total (T) and phosphorylated (P) ERK and EIF4E were examined by Western blot (n = 3). B, Quantitative analysis of A. The density of each band was calibrated with its corresponding Actin band. Relative phosphorylation levels were quantified by dividing P over T, which was then compared with the level in control MSCsVector to set as 1. C, MSCs were transfected with control (NC)‐ or GDF11‐specific siRNA. Total (T) and phosphorylated (P) ERK and EIF4E were examined by Western blot (n = 3). D, Quantitative analysis of C in the same way as B. E, MSCsVector and MSCGDF11 were cultured with VEGF165 for EC differentiation in the presence or absence of inhibitors for TGF‐β receptor (LY2109761) or for ERK (SD5978) for 14days. T‐ and P‐ ERK and EIF4E were examined by Western blot. F, Quantitative analysis of E. Data are presented as the mean ± SD. *P < 0.05; **P < 0.01 and ***P < 0.001. Each WB was repeated for at least 2 times
