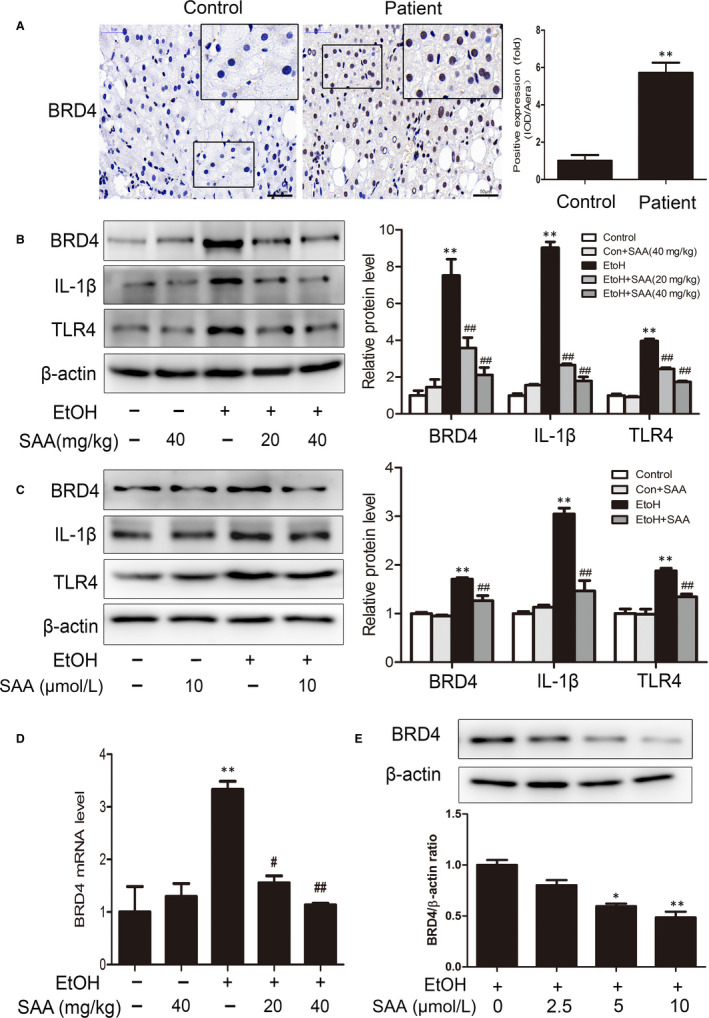
Figure 3.

Effects of SAA on the BRD4 protein level in vivo and in vitro. A, IHC staining for BRD4. Scale bar, 50 μm. (n = 3). B, Western blotting analysis of the hepatic BRD4, TLR4 and IL‐1β protein levels in rats (n = 3). C, AML‐12 cells were pre‐treated with SAA (10 μmol/L) for 6 h before exposure to ethanol (100 mmol/L) for 24 h. BRD4, TLR4 and IL‐1β protein expression (n = 3). D, The mRNA levels of BRD4 in rats were measured by real‐time PCR (n = 3). E, AML‐12 cells were pre‐treated with 2.5, 5 or 10 µmol/L SAA for 6 h before exposure to ethanol (100 mmol/L) for 24 h. The figure shows independent response of BRD4 to SAA treatment (n = 3). * P <.05, ** P < .01 vs the control group; ## P < .01 vs the alcoholic group
