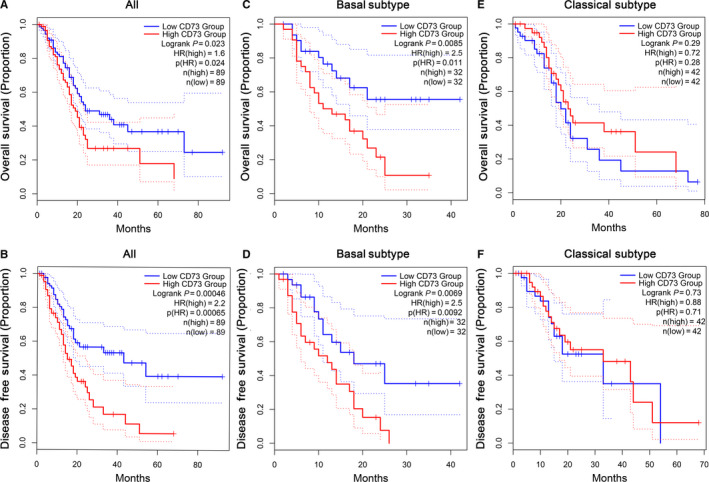
FIGURE 2.

The relationship between CD73 expression and prognosis in PC analysed by GEPIA2. (A) OS and (B) DFS of all PAAD patients in TCGA cohort based on CD73 expression. (C) OS and (D) DFS in PAAD patients with basal subtype based on CD73 expression. (E) OS and (F) DFS in PAAD patients with classical subtype based on CD73 expression. The dotted lines represent the 95% confidence interval. OS, overall survival; DFS, disease‐free survival; PAAD, pancreatic adenocarcinoma
