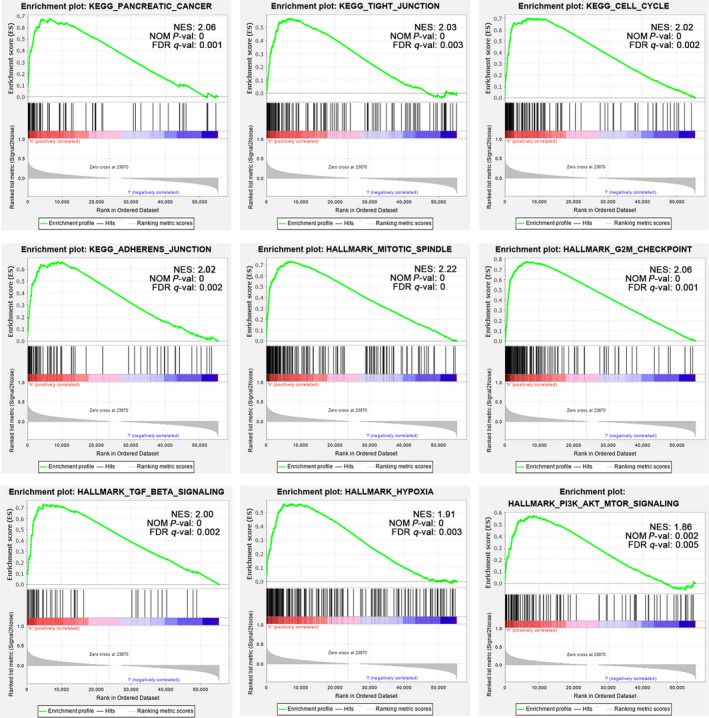
FIGURE 4.

Enrichment plots from GSEA. GSEA results showing pancreatic cancer, cell cycle, tight junction, adherens junction, mitotic spindle, G2M checkpoint, TGF‐β signaling, hypoxia and PI3K‐AKT‐MTOR signalling are differentially enriched in PC cases with high CD73 expression. Gene sets with a normalized P‐value <.01 and false discovery rate (FDR) <.05 are considered as significant. GESA, Gene Set Enrichment Analysis; TGF‐β, Transforming growth factor β
